PDF

Pinched Flow Fractionation
Introduction
Pinched flow fractionation (PFF) is a purely hydrodynamic method of separating particles by size or mass, using a microfluidic device. The separation of particles is critical in many biomedical applications (Ref. 1). One of the popular areas of interest is the separation of cells from whole blood such as red blood cells, white blood cells, and platelets. A clear blood plasma is also utilized in cancer detection.
This is a tutorial model of a microfluidic device with two inlets. Inlet 1 delivers a sample of fluid containing particles to separate while inlet 2 delivers pure fluid with no particles at a significantly higher flow rate than the first. When the two inlets converge at a narrow microchannel, the stream carrying the sample is pinched into a narrow region near the wall opposite the high-velocity flow. The smaller particles are pushed closer to the wall. After entering the microchannel, the wall-induced lift force pushes the particles towards the center of the channel. Under the combination of lift and drag forces, the particles become sorted by size, with larger particles migrating closer to the center of the channel.. The sample then enters a wider section that branches into many outlets. The particles exit through different branches based on their lateral position when exiting the microchannel, effectively sorting the particles by size.
The outlet at the end close to inlet 2 is called the drain. When the drain is shorter and/or broader than the other outlets, then the method is called asymmetrical pinched flow fractionation (AsPFF) (Ref. 2). AsPFF has lesser resistance to the flow in the drain and hence allows more liquid to flow. This in turn allows the wider spread of streamlines along the outlets and hence the separation utilizes more of the outlet branches and the range of sizes of particles collected by each outlet becomes smaller. Thus AsPFF allows better fractionation of particles compared to PFF. The model used in this example can be used to simulate both PFF and AsPFF by simply changing the value of ratio of drain length to branch length in the geometry.
Model Definition
The geometry consists of two inlets each of width 0.1 mm and length 0.5 mm fused with each other at an angle of 45°. The inlets converge to a microchannel of width 20 μm and length 120 μm. The microchannel opens to a wider opening which is divided into twelve outlets and one drain. The distance of each outlet from the midpoint of opening of microchannel is 1 mm while the distance to the drain outlet is 0.5 mm. The dimensions of inlets, microchannel, outlets, and drain and the number of outlets can be changed by editing appropriate parameters of the geometry.
Figure 1: Model geometry of asymmetric pinched flow fractionation device. Fluid enters through two inlets on the left and exits through the 13 numbered outlets.
Figure 2: The mesh is refined around the entrance of microchannel and near corners.
The sample used here is water containing spherical particles of density 1300 kg/m3, with diameters uniformly distributed between 1.5 μm and 11 μm. The inlet in the upper left corner of Figure 1 delivers the sample at the rate of 25 μl/hr. The inlet in the lower left corner delivers pure water at the rate of 1200 μl/hr. The outlet branches are numbered from 0 to 12 in a clockwise direction, with 12 being the drain in Figure 1. The microchannel should be meshed at higher resolution relative to the rest of the geometry. When the particle enters the microchannel there is sudden change in the velocity, thus the entrance is manually meshed to finer sizes as shown in Figure 2.
The geometry is divided into three domains; the first domain consists of inlets, second domain is the microchannel, and the third domain includes the outlets. The lift force is most significant in the microchannel where the particles will be in very close proximity to the channel walls. Thus the lift force is applied only in the second domain using the Lift Force feature. The drag force is applied in all domains using the Drag Force feature.
Notes on COMSOL Implementation
The model is solved in two steps. First, the fluid velocity and pressure are solved using the Laminar Flow interface and Stationary study step. Then the particle trajectories is created using the Particle Tracing for Fluid Flow interface and Time Dependent study step.
A total of 100 particles are released, one at every 5 ms. The released particles have random diameter between 1.5 μm and 11 μm and random position along the boundary. The particles cannot be released very close to the walls of inlet because the wall induced lift force gives nonphysical values if distance between wall and particle is less than the particle radius, so only the middle 80% of the inlet boundary is used to generate the particles. To release particles with random diameters, Specify particle diameter needs to be chosen from the Particle size distribution options in the Additional Variables setting of the Particle Tracing for Fluid Flow interface.
The asymmetric flow of fluid in the drain outlet is easily captured using an Outlet feature in the Laminar Flow interface. A boundary condition of zero gauge pressure is applied to each outlet. The pressure drop along the drain channel is faster because of its smaller length which results in a higher flow rate compared to the other branches.
For the smallest particles in this model, the relaxation time is approximately 0.16 μs, which is about three million times smaller than the maximum output time. However, the default time-dependent solver for most particle tracing models is a second-order implicit method that handles numerically stiff problems rather well, even when taking time steps that are larger than the relaxation time. Nevertheless, the smallest particles are still the main driver of the computational cost of transient inertial particle tracing simulations.
Results and Discussion
The velocity field and the streamlines are shown in Figure 3. The streamlines closer to the upper wall of the microchannel lead to the upper branches whereas those closer to the lower wall lead towards lower branches or into the drain. The effect of AsPFF is seen in the greater density of streamlines in the drain where the flow rate is higher due to its lower viscous losses compared to the other branches.
Figure 3: Velocity field and streamlines for the fluid flow
When the fluid from two inlets are squeezed through the microchannel, the particles are sorted based on their size as the lift force pushes the larger particle farther from the wall in perpendicular direction to the flow. When the particles exit the microchannel, they flow with the fluid towards different outlets based on their lateral position in the channel and their inertia (Figure 4).
When zooming in very close to the ends of the microchannel, most notably the right end, some particle trajectories may appear to pass through the channel walls instead of exiting through the end of the microchannel. This is just an artifact of the way that the lines in particle trajectory plots are displayed, with interpolation between a discrete number of output times. If the number of output times were significantly increased, the particles would appear to exit the channel normally, but the file size would be much larger.
Figure 4: Particle trajectories colored by particle size top of fluid velocity field. The background shows the fluid velocity magnitude on a logarithmic scale
Figure 5 is a histogram that shows the number of particles exiting from each outlet. In this simulation, the particles exit from first 5 outlet branches. In addition, Figure 6 is a 2D histogram that shows the particle sizes exiting from each outlet.
These two histograms give a clear quantitative picture of sorting of particles using the AsPFF method. Because the model is fully parameterized, a natural extension would be to use a Parametric Sweep or some optimization functionality to utilize a larger number of outlet branches, while simultaneously reducing the range of particle diameters that exit through any single branch.
Figure 5: Histogram of number of particles exiting through each outlet branch.
Figure 6: 2D histogram showing the range of particle size exiting through each outlet branch.
References
1. D.R. Gossett, W.M. Weaver, A.J. Mach, S.C. Hur, H.T.K. Tse, W. Lee, H. Amini, and D. Di Carlo, “Label-free cell separation and sorting in microfluidic systems,” Anal. Bioanal. Chem., vol. 397, p. 3249–3267, 2010.
2. J. Takagi, M. Yamada, M. Yasuda, and M. Seki, “Continuous particle separation in a microchannel having asymmetrically arranged multiple branches,” Lab Chip, vol. 5, p. 778–784, 2005.
Application Library path: Particle_Tracing_Module/Fluid_Flow/pinched_flow_fractionation
Modeling Instructions
From the File menu, choose New.
New
In the New window, click  Model Wizard.
Model Wizard
1
In the Model Wizard window, click  2D.
2
In the Select Physics tree, select Fluid Flow>Single-Phase Flow>Laminar Flow (spf).
3
Click Add.
4
Click  Study.
5
In the Select Study tree, select General Studies>Stationary.
6
Global Definitions
Parameters 1
1
In the Model Builder window, under Global Definitions click Parameters 1.
2
In the Settings window for Parameters, locate the Parameters section.
3
Geometry 1
Insert the prepared geometry sequence from file. You can read the instructions for creating the geometry in the appendix.
1
In the Geometry toolbar, click Insert Sequence and choose Insert Sequence.
2
3
In the Geometry toolbar, click  Build All. The geometry should look like Figure 1.
Definitions
Variables 1
1
In the Home toolbar, click  Variables and choose Local Variables.
2
In the Settings window for Variables, locate the Variables section.
3
Add Material
1
In the Home toolbar, click  Add Material to open the Add Material window.
2
Go to the Add Material window.
3
In the tree, select Built-in>Water, liquid.
4
Click Add to Component in the window toolbar.
5
In the Home toolbar, click  Add Material to close the Add Material window.
Laminar Flow (spf)
First the Laminar Flow interface is used to calculate the velocity and pressure fields resulting from fluid entering through two inlets at different flow rates.
Inlet 1
1
In the Model Builder window, under Component 1 (comp1) right-click Laminar Flow (spf) and choose Inlet.
2
3
In the Settings window for Inlet, locate the Boundary Condition section.
4
From the list, choose Fully developed flow.
5
Locate the Fully Developed Flow section. Click the Flow rate button.
6
In the V0 text field, type V1.
7
In the Dz text field, type Wi.
The channel has a square cross section so the out-of-plane thickness in this case equals the in-plane width.
Inlet 2
1
In the Physics toolbar, click  Boundaries and choose Inlet.
2
3
In the Settings window for Inlet, locate the Boundary Condition section.
4
From the list, choose Fully developed flow.
5
Locate the Fully Developed Flow section. Click the Flow rate button.
6
In the V0 text field, type V2.
7
In the Dz text field, type Wi.
Outlet 1
1
In the Physics toolbar, click  Boundaries and choose Outlet.
2
Mesh 1
1
In the Model Builder window, under Component 1 (comp1) click Mesh 1.
2
In the Settings window for Mesh, locate the Sequence Type section.
3
From the list, choose User-controlled mesh.
Size
1
In the Model Builder window, under Component 1 (comp1)>Mesh 1 click Size.
2
In the Settings window for Size, locate the Element Size section.
3
From the Predefined list, choose Extra fine.
Size 1
1
In the Model Builder window, click Size 1.
2
In the Settings window for Size, locate the Element Size section.
3
From the Predefined list, choose Extra fine.
Size 2
1
In the Mesh toolbar, click  Sizing and choose Size.
2
3
In the Settings window for Size, locate the Geometric Entity Selection section.
4
From the Geometric entity level list, choose Boundary.
5
6
Locate the Element Size section. Click the Custom button.
7
Locate the Element Size Parameters section. Select the Maximum element size check box.
8
9
Click  Build All. The mesh should look like Figure 2.
Study 1
Step 1: Stationary
In the Home toolbar, click  Compute.
Results
Surface
1
In the Model Builder window, expand the Velocity (spf) node, then click Surface.
2
In the Settings window for Surface, locate the Coloring and Style section.
3
From the Color table list, choose Prism.
Velocity (spf)
In the Model Builder window, click Velocity (spf).
Streamline 1
1
In the Velocity (spf) toolbar, click  Streamline.
2
In the Settings window for Streamline, locate the Streamline Positioning section.
3
From the Positioning list, choose Magnitude controlled.
4
In the Density text field, type 40.
5
In the Velocity (spf) toolbar, click  Plot. The plot should look like Figure 3.
Add Physics
Next, calculate the particle trajectories using the Particle Tracing for Fluid Flow interface.
1
In the Home toolbar, click  Add Physics to open the Add Physics window.
2
Go to the Add Physics window.
3
In the tree, select Fluid Flow>Particle Tracing>Particle Tracing for Fluid Flow (fpt).
4
Click Add to Component 1 in the window toolbar.
5
In the Home toolbar, click  Add Physics to close the Add Physics window.
Particle Tracing for Fluid Flow (fpt)
1
In the Settings window for Particle Tracing for Fluid Flow, locate the Additional Variables section.
2
From the Particle size distribution list, choose Specify particle diameter.
Particle Properties 1
1
In the Model Builder window, under Component 1 (comp1)>Particle Tracing for Fluid Flow (fpt) click Particle Properties 1.
2
In the Settings window for Particle Properties, locate the Particle Properties section.
3
From the ρp list, choose User defined. In the associated text field, type rho_p.
Inlet 1
1
In the Physics toolbar, click  Boundaries and choose Inlet.
2
3
In the Settings window for Inlet, locate the Release Times section.
4
Click  Range.
5
In the Range dialog box, type 0 in the Start text field.
6
In the Step text field, type 0.05.
7
In the Stop text field, type 5.
8
Click Replace.
9
In the Settings window for Inlet, locate the Initial Position section.
10
From the Initial position list, choose Random.
11
Locate the Initial Velocity section. From the u list, choose Velocity field (spf).
12
Locate the Initial Particle Diameter section. From the Distribution function list, choose Uniform.
13
From the Sampling from distribution list, choose Random.
14
In the dp,min text field, type d_min.
15
In the dp,max text field, type d_max.
The number of particles per release and the number of particle diameter values are both 1 because these numbers multiply with each other and with the number of release times. So in this case, only one particle is released per release time. If a large number is used in any one or both of the values, then it could result in an inordinate number of particles being released.
Drag Force 1
1
In the Physics toolbar, click  Domains and choose Drag Force.
2
In the Settings window for Drag Force, locate the Domain Selection section.
3
From the Selection list, choose All domains.
4
Locate the Drag Force section. From the u list, choose Velocity field (spf).
Lift Force 1
1
In the Physics toolbar, click  Domains and choose Lift Force.
2
3
In the Settings window for Lift Force, locate the Lift Force section.
4
From the Lift law list, choose Wall induced.
5
Locate the Parallel Boundary 1 section. Click to select the  Activate Selection toggle button.
6
7
Locate the Parallel Boundary 2 section. Click to select the  Activate Selection toggle button.
8
9
Locate the Lift Force section. From the u list, choose Velocity field (spf).
Add Study
1
In the Home toolbar, click  Add Study to open the Add Study window.
2
Go to the Add Study window.
3
Find the Studies subsection. In the Select Study tree, select General Studies>Time Dependent.
4
Find the Physics interfaces in study subsection. In the table, clear the Solve check box for Laminar Flow (spf).
5
Click Add Study in the window toolbar.
6
In the Home toolbar, click  Add Study to close the Add Study window.
Study 2
Step 1: Time Dependent
1
In the Settings window for Time Dependent, locate the Study Settings section.
2
Click  Range.
3
In the Range dialog box, type 1e-3 in the Step text field.
4
In the Stop text field, type 5.
5
Click Replace.
6
In the Settings window for Time Dependent, click to expand the Values of Dependent Variables section.
7
Find the Values of variables not solved for subsection. From the Settings list, choose User controlled.
8
From the Method list, choose Solution.
9
From the Study list, choose Study 1, Stationary.
10
In the Home toolbar, click  Compute.
Results
Particle Trajectories 1
1
In the Model Builder window, expand the Particle Trajectories (fpt) node, then click Particle Trajectories 1.
2
In the Settings window for Particle Trajectories, locate the Coloring and Style section.
3
Find the Line style subsection. From the Type list, choose Line.
Color Expression 1
1
In the Model Builder window, expand the Particle Trajectories 1 node, then click Color Expression 1.
2
In the Settings window for Color Expression, locate the Expression section.
3
In the Expression text field, type fpt.dp.
4
Locate the Coloring and Style section. From the Color table list, choose Plasma.
Particle Trajectories (fpt)
In the Model Builder window, under Results click Particle Trajectories (fpt).
Surface 1
1
In the Particle Trajectories (fpt) toolbar, click  Surface.
2
In the Settings window for Surface, locate the Data section.
3
From the Dataset list, choose Study 1/Solution 1 (sol1).
4
Locate the Coloring and Style section. From the Color table list, choose GrayPrint.
5
From the Scale list, choose Logarithmic.
6
In the Particle Trajectories (fpt) toolbar, click  Plot. The plot should look like Figure 4.
Animation 1
1
In the Particle Trajectories (fpt) toolbar, click  Animation and choose Player.
2
In the Settings window for Animation, locate the Frames section.
3
In the Number of frames text field, type 100.
4
Click the  Play button in the Graphics toolbar.
1D Histogram
1
In the Home toolbar, click  Add Plot Group and choose 1D Plot Group.
2
In the Settings window for 1D Plot Group, type 1D Histogram in the Label text field.
3
Locate the Data section. From the Dataset list, choose Particle 1.
4
From the Time selection list, choose Last.
Histogram 1
1
In the 1D Histogram toolbar, click  Histogram.
2
In the Settings window for Histogram, locate the Expression section.
3
In the Expression text field, type exit.
4
Locate the Bins section. In the Number text field, type 5.
5
Locate the Output section. From the Function list, choose Discrete.
Filter 1
1
In the 1D Histogram toolbar, click  Filter.
2
In the Settings window for Filter, locate the Point Selection section.
3
In the Logical expression for inclusion text field, type x>Pb.
4
In the 1D Histogram toolbar, click  Plot. The plot should look like Figure 5.
2D Histogram
1
In the Home toolbar, click  Add Plot Group and choose 2D Plot Group.
2
In the Settings window for 2D Plot Group, type 2D Histogram in the Label text field.
3
Locate the Data section. From the Dataset list, choose Particle 1.
Histogram 1
1
In the 2D Histogram toolbar, click  More Plots and choose Histogram.
2
In the Settings window for Histogram, locate the x-Expression section.
3
In the Expression text field, type exit.
4
Locate the y-Expression section. In the Expression text field, type fpt.dp.
5
From the Unit list, choose µm.
6
Locate the Bins section. Find the x bins subsection. In the Number text field, type 5.
7
Find the y bins subsection. In the Number text field, type 40.
8
Locate the Output section. From the Function list, choose Discrete.
9
Locate the Coloring and Style section. From the Color table list, choose Prism.
Filter 1
1
In the 2D Histogram toolbar, click  Filter.
2
In the Settings window for Filter, locate the Point Selection section.
3
In the Logical expression for inclusion text field, type x>Pb.
4
In the 2D Histogram toolbar, click  Plot. The plot should look like Figure 6.
5
Click the  Zoom Extents button in the Graphics toolbar.
Appendix: Geometry Instructions
From the File menu, choose New.
New
In the New window, click  Model Wizard.
Model Wizard
1
In the Model Wizard window, click  2D.
2
Global Definitions
Geometry parameters
1
In the Model Builder window, under Global Definitions click Parameters 1.
2
In the Settings window for Parameters, type Geometry parameters in the Label text field.
3
Locate the Parameters section. Click  Load from File.
4
Browse to the model’s Application Libraries folder and double-click the file pinched_flow_fractionation_geom_sequence_parameters.txt.
Geometry 1
1
In the Model Builder window, under Component 1 (comp1) click Geometry 1.
2
In the Settings window for Geometry, locate the Units section.
3
From the Length unit list, choose mm.
Rectangle 1 (r1)
1
In the Geometry toolbar, click  Rectangle.
2
In the Settings window for Rectangle, locate the Size and Shape section.
3
In the Width text field, type Li.
4
In the Height text field, type Wi.
5
Locate the Position section. In the y text field, type -sin(HAi)*Li.
6
Locate the Rotation Angle section. In the Rotation text field, type HAi.
7
Click  Build Selected.
Mirror 1 (mir1)
1
In the Geometry toolbar, click  Transforms and choose Mirror.
2
3
In the Settings window for Mirror, locate the Input section.
4
Select the Keep input objects check box.
5
Locate the Normal Vector to Line of Reflection section. In the x text field, type 0.
6
In the y text field, type 1.
7
Click  Build Selected.
8
Click the  Zoom Extents button in the Graphics toolbar.
Point 1 (pt1)
1
In the Geometry toolbar, click  Point.
2
In the Settings window for Point, locate the Point section.
3
In the x text field, type -0.1*Wi*cos(Ai).
4
In the y text field, type sin(HAi)*Li-0.1*Wi*sin(Ai).
5
Click  Build Selected.
Point 2 (pt2)
1
In the Geometry toolbar, click  Point.
2
In the Settings window for Point, locate the Point section.
3
In the x text field, type -0.9*Wi*cos(Ai).
4
In the y text field, type sin(HAi)*Li-0.9*Wi*sin(Ai).
5
Click  Build Selected.
Union 1 (uni1)
1
In the Geometry toolbar, click  Booleans and Partitions and choose Union.
2
Click in the Graphics window and then press Ctrl+A to select all objects.
3
In the Settings window for Union, click  Build Selected.
Delete Entities 1 (del1)
1
In the Geometry toolbar, click  Delete.
2
In the Settings window for Delete Entities, locate the Entities or Objects to Delete section.
3
From the Geometric entity level list, choose Boundary.
4
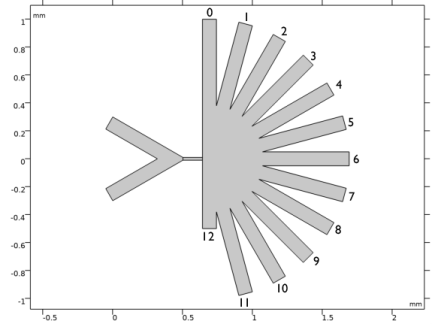
On the object uni1, select Boundaries 9–11, 13, 15, and 16 only.
5
Click  Build Selected.
Line Segment 1 (ls1)
1
In the Geometry toolbar, click  More Primitives and choose Line Segment.
2
In the Settings window for Line Segment, locate the Starting Point section.
3
From the Specify list, choose Coordinates.
4
In the x text field, type Pc.
5
In the y text field, type HWc.
6
Locate the Endpoint section. From the Specify list, choose Coordinates.
7
In the x text field, type Pc.
8
In the y text field, type -HWc.
9
Click  Build Selected.
Partition Objects 1 (par1)
1
In the Geometry toolbar, click  Booleans and Partitions and choose Partition Objects.
2
3
In the Settings window for Partition Objects, locate the Partition Objects section.
4
Find the Tool objects subsection. Click to select the  Activate Selection toggle button.
5
6
Click  Build Selected.
Delete Entities 2 (del2)
1
In the Geometry toolbar, click  Delete.
2
In the Settings window for Delete Entities, locate the Entities or Objects to Delete section.
3
From the Geometric entity level list, choose Domain.
4
On the object par1, select Domain 2 only.
5
Click  Build Selected.
Rectangle 2 (r2)
1
In the Geometry toolbar, click  Rectangle.
2
In the Settings window for Rectangle, locate the Size and Shape section.
3
In the Width text field, type Lc.
4
In the Height text field, type Wc.
5
Locate the Position section. In the x text field, type Pc.
6
In the y text field, type -HWc.
7
Click  Build Selected.
Rectangle 3 (r3)
1
In the Geometry toolbar, click  Rectangle.
2
In the Settings window for Rectangle, locate the Size and Shape section.
3
In the Width text field, type Wb.
4
In the Height text field, type Lb.
5
Locate the Position section. In the x text field, type Pb.
6
Click  Build Selected.
Rotate 1 (rot1)
1
In the Geometry toolbar, click  Transforms and choose Rotate.
2
3
In the Settings window for Rotate, locate the Rotation section.
4
Click  Range.
5
In the Range dialog box, type 0 in the Start text field.
6
In the Step text field, type -180/Nb.
7
In the Stop text field, type -180.
8
Click Replace.
9
In the Settings window for Rotate, locate the Center of Rotation section.
10
In the x text field, type Cr.
11
Locate the Selections of Resulting Entities section. Select the Resulting objects selection check box.
12
From the Show in physics list, choose Off.
13
Click  Build Selected.
14
Click the  Zoom Extents button in the Graphics toolbar.
Union 2 (uni2)
1
In the Geometry toolbar, click  Booleans and Partitions and choose Union.
2
In the Settings window for Union, locate the Union section.
3
From the Input objects list, choose Rotate 1.
4
Clear the Keep interior boundaries check box.
5
Click  Build Selected.
Rectangle 4 (r4)
1
In the Geometry toolbar, click  Rectangle.
2
In the Settings window for Rectangle, locate the Size and Shape section.
3
In the Width text field, type Wb.
4
In the Height text field, type Ld+0.01*Lb.
5
Locate the Position section. In the x text field, type Pb.
6
In the y text field, type -Lb*1.01.
7
Click  Build Selected.
Difference 1 (dif1)
1
In the Geometry toolbar, click  Booleans and Partitions and choose Difference.
2
3
In the Settings window for Difference, locate the Difference section.
4
Find the Objects to subtract subsection. Click to select the  Activate Selection toggle button.
5
6
Click  Build Selected.
Form Union (fin)
In the Geometry toolbar, click  Build All.