PDF

Creep Analysis of a Turbine Stator Blade
Introduction
The conditions within gas turbines are extreme. The pressure can be as high as 40  bars, and the temperature far above 1000 K. Any new component must therefore be carefully designed to be able to withstand thermal stress and vibrations due to the rotating machinery and aerodynamic loads exerted by the fluid rushing through the turbine. If a component fails, the high rotational speeds can result in a complete collapse of the whole turbine.
This example performs an analysis of creep deformation caused by thermal stress during operation conditions. The model is an extension of the Thermal Stress Analysis of a Turbine Stator Blade example from the Structural Mechanics Module Application Library. The setup of the stationary thermal stress problem is discussed thereafter. The focus of this example is on the extension of the original model to include creep deformation in a time-dependent analysis.
Note: This application requires the CFD Module or the Heat Transfer Module to solve the stationary problem.
Model Definition
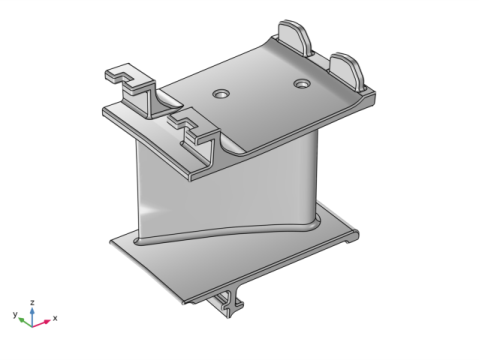
The model geometry is shown in Figure 1 The stator blade profile is a modified version of a design shown in Ref. 1. The geometry also includes some generic mounting details as well as a generic internal cooling duct.
Figure 1: A stator blade with mounting details.
The blade and the mounting details are made of a directionally solidified (DS) GTD111 nickel-based alloy. The basic properties of this alloy are available in the COMSOL Material Library, including for example a temperature-dependent Young’s modulus. In addition to the data included in the Material Library, the linear elastic model set up requires a reference temperature of 310 K and a Poisson’s ratio equal to 0.33, a value comparable to other stainless steels.
Creep deformation is included in the analysis by adding a Creep node to the linear elastic material model. The creep properties of (DS) GTD111 are highly influenced by both temperature and stress. Furthermore, the directional solidification of the alloy leads to anisotropic behavior. While this anisotropy could be included by using the Hill’s orthotropic equivalent stress available under the Creep node, it is however assumed that creep deformation is isotropic, given that the grain directions in the component are unknown.
The example considers secondary creep only, which can be described by a thermally activated Norton creep model. The rate of the creep strain εcr is then given by
(1)
where A is the creep rate coefficient, n is the stress exponent, and σref is a reference stress level. The temperature dependence is controlled by an Arrhenius function where Q is the activation energy, R is the gas constant, T is the current absolute temperature of the material, and Tref is the reference temperature for the activation energy.
Creep properties of (DS) GTD111 are difficult to determine, the data to predict the secondary creep using Equation 1 is summarized in Table 1.
σref
Tref
The creep deformation of the component is studied during a period of 400 h of constant and stable operation. During this period, the temperature conditions are assumed constant, and the temperature is therefore not solved in the time-dependent study step. The temperature and initial conditions for the displacements and stress are solved in the preceding stationary study step set up, described in the reference model. That model also includes the definition of all relevant boundary conditions and loads.
Results and Discussion
The accumulated amount of creep strain after 400 h of isothermal operation is shown in Figure 2. It is observed that the maximum creep strain reaches a value of approximately 1%. Creep rupture of (DS) GTD111 has been reported to occur at around 10% creep strain, so the stator blade still has plenty of safety margin after 400 h of stable operation. There is no risk that cracks start to form, neither that the tertiary creep regime is entered.
An interesting observation, when comparing the distribution of the equivalent creep strain in Figure 2 to the stress state at the beginning of the time-dependent step shown in Figure 3; is that the maximum creep strain does not coincide with the peak stress. This is caused by the temperature distribution, where areas around the cooling ducts’ inlets and outlets have a lower temperature than other parts of the stator blade.
The stress relaxation caused by creep is clearly visible when comparing Figure 3 to the stress distribution after 400 h of operation. The stress level decreases by several hundreds of MPa after this time lapse.
The variation of the maximum creep strain in the component is shown in Figure 5. It is concluded that most of the creep deformation occurs during the initial operational hours, and that stress relaxation also leads to a reduced creep rate. Note that Figure 5 shows the maximum creep strain in the entire component, and that the actual material point where maximum creep occurs may change between time steps.
Figure 2: Distribution of the equivalent creep strain after 400 h of stable operation.
.
Figure 3: Distribution of von Mises stress at the start of operation.
Figure 4: Distribution of von Mises stress after 400 h of stable operation.
Figure 5: Maximum creep strain in the stator blade versus time.
Reference
1. NASA, “Power Turbine”, Glenn Research Center, www.grc.nasa.gov/WWW/K-12/airplane/powturb.html.
Application Library path: Nonlinear_Structural_Materials_Module/Creep/turbine_stator_creep
Modeling Instructions
Application Libraries
1
From the File menu, choose Application Libraries.
2
In the Application Libraries window, select Structural Mechanics Module>Thermal-Structure Interaction>turbine_stator in the tree.
3
Component 1 (comp1)
Add a creep model to the physics and creep properties to the material.
1
In the Model Builder window, expand the Component 1 (comp1) node.
Solid Mechanics (solid)
Linear Elastic Material 1
The local computations at Gauss points during assembly are expensive for creep models. Using a reduced integration scheme will reduce the overall simulation time.
1
In the Model Builder window, expand the Component 1 (comp1)>Solid Mechanics (solid) node, then click Linear Elastic Material 1.
2
In the Settings window for Linear Elastic Material, locate the Quadrature Settings section.
3
Select the Reduced integration check box.
Creep 1
1
In the Physics toolbar, click  Attributes and choose Creep.
2
In the Settings window for Creep, locate the Creep Model section.
3
Find the Thermal effects subsection. From the g  (T) list, choose Arrhenius.
4
In the Tref text field, type T_work.
5
In the Q text field, type 350[kJ/mol].
Materials
GTD111 DS [solid,longitudinal] (mat1)
1
In the Model Builder window, expand the Component 1 (comp1)>Materials node, then click GTD111 DS [solid,longitudinal] (mat1).
2
In the Settings window for Material, locate the Material Contents section.
3
Monitor the maximum equivalent creep strain in the component using a Domain Probe.
Definitions
Domain Probe 1 (dom1)
1
In the Model Builder window, expand the Component 1 (comp1)>Definitions node.
2
Right-click Definitions and choose Probes>Domain Probe.
3
In the Settings window for Domain Probe, locate the Probe Type section.
4
From the Type list, choose Maximum.
5
Locate the Expression section. In the Expression text field, type solid.eceGp.
6
Select the Description check box.
7
In the associated text field, type Equivalent creep strain.
Study 1
Step 2: Time Dependent
1
In the Model Builder window, expand the Study 1 node.
2
Right-click Study 1 and choose Study Steps>Time Dependent>Time Dependent.
3
In the Settings window for Time Dependent, locate the Study Settings section.
4
From the Time unit list, choose h.
5
In the Output times text field, type 0 10 100 400.
The temperature is assumed constant during operations.
6
Locate the Physics and Variables Selection section. In the table, clear the Solve for check box for Heat Transfer in Solids (ht).
Reset the solver to its default, and modify the generated solver sequence to improve the performance of the model.
Solution 1 (sol1)
1
In the Model Builder window, right-click Solver Configurations and choose Reset Solver to Default.
2
Expand the Solution 1 (sol1) node.
Heat Transfer in Solids and Solid Mechanics are in this model one-way coupled. This allows the physics to be solved in series, which is more efficient than the suggested default solver.
3
In the Model Builder window, expand the Study 1>Solver Configurations>Solution 1 (sol1)>Stationary Solver 1 node, then click Segregated 1.
4
In the Settings window for Segregated, locate the General section.
5
From the Termination technique list, choose Iterations.
6
In the Model Builder window, expand the Study 1>Solver Configurations>Solution 1 (sol1)>Stationary Solver 1>Segregated 1 node, then click Temperature.
7
In the Settings window for Segregated Step, click to expand the Method and Termination section.
8
From the Termination technique list, choose Tolerance.
9
In the Tolerance factor text field, type 1.
10
In the Model Builder window, click Solid Mechanics.
11
In the Settings window for Segregated Step, locate the Method and Termination section.
12
From the Termination technique list, choose Tolerance.
13
In the Tolerance factor text field, type 1.
When working with inelastic material models such as creep, it is preferable to store data at steps taken by the solver to avoid interpolation errors during result evaluation.
14
In the Model Builder window, click Time-Dependent Solver 1.
15
In the Settings window for Time-Dependent Solver, click to expand the Time Stepping section.
16
From the Steps taken by solver list, choose Strict.
Step 2: Time Dependent
In the Model Builder window, under Study 1 right-click Step 2: Time Dependent and choose Get Initial Value for Step to customize the probe plot before solving.
Results
Equivalent Creep Strain vs Time
1
In the Settings window for 1D Plot Group, type Equivalent Creep Strain vs Time in the Label text field.
2
Locate the Plot Settings section. Select the y-axis label check box.
3
In the associated text field, type Equivalent creep strain (1).
4
Locate the Legend section. Clear the Show legends check box.
Probe Table Graph 1
1
In the Model Builder window, expand the Equivalent Creep Strain vs Time node, then click Probe Table Graph 1.
2
In the Settings window for Table Graph, locate the Coloring and Style section.
3
Find the Line markers subsection. From the Marker list, choose Circle.
4
From the Positioning list, choose In data points.
Study 1
In the Study toolbar, click  Compute.
Results
Stress (solid)
In the Stress (solid) toolbar, click  Plot.
Equivalent Creep Strain
1
Right-click Stress (solid) and choose Duplicate.
2
In the Settings window for 3D Plot Group, type Equivalent Creep Strain in the Label text field.
Volume 1
1
In the Model Builder window, expand the Equivalent Creep Strain node, then click Volume 1.
2
In the Settings window for Volume, locate the Expression section.
3
In the Expression text field, type solid.eceGp.
4
In the Equivalent Creep Strain toolbar, click  Plot.
5
Click to expand the Range section. Select the Manual color range check box.
6
In the Minimum text field, type 0.
7
In the Maximum text field, type 0.005.
8
Locate the Coloring and Style section. From the Color table transformation list, choose Nonlinear.
9
In the Color calibration parameter text field, type -.7.
10
In the Equivalent Creep Strain toolbar, click  Plot.
Equivalent Creep Strain vs Time
1
In the Model Builder window, under Results click Equivalent Creep Strain vs Time.
2
In the Settings window for 1D Plot Group, locate the Legend section.
3
Clear the Show legends check box.