PDF

Electrowetting Lens
Introduction
The contact angle of a two-fluid interface with a solid surface is determined by the balance of the forces at the contact point. The equilibrium contact angle, θ0, is given by Young’s equation:
(1)
Here γs1 is the surface energy per unit area between fluid 1 and the solid surface, γs2 is the surface energy per unit area between fluid 2 and the solid surface, and σ12 is the surface tension at the interface between the two fluids.
In electrowetting the balance of forces at the contact point is modified by the application of a voltage between a conducting fluid and the solid surface. In many applications the solid surface consists of a thin dielectric deposited onto a conducting layer; this is often referred to as “Electrowetting on Dielectric” (EWOD). In this case the capacitance of the dielectric layer dominates over the double layer capacitance at the solid-liquid interface (Ref. 1). The energy stored in the capacitor formed between the conducting liquid and the conducting layer in the solid reduces the effective surface energy of the liquid to which the voltage is applied. If there is a voltage difference between fluid 1 and the conductor beyond the dielectric, Young’s equation is modified as follows:
(2)
Here ε is the permittivity of the dielectric, V is the potential difference applied, and df is the dielectric thickness. Combining Equation 1 and Equation 2 yields
(3)
Electrowetting can therefore be used to modify the contact angle dynamically by changing the voltage applied to the conducting liquid.
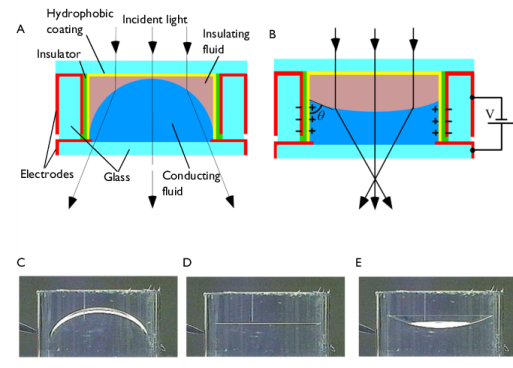
In this example, the meniscus between two immiscible liquids is used as an optical lens. A change in curvature of the meniscus caused by the electrowetting effect is used to change the focal length of the lens over a large range. This model is based on the work of the Philips FluidFocus team (Ref. 2). The principle of the device is illustrated in Figure 1 and the miniature, variable focus camera developed around the technology is shown in Figure 2.
Figure 1: (A) Schematic cross section of the Philips FluidFocus lens. (B) When a voltage is applied, the electrowetting effect alters the contact angle and hence the focal distance of the lens. (C) to (E) Shapes of a 6-mm diameter lens taken at 0 V, 100 V and 120 V respectively. Diagrams and photos: Philips.
Figure 2: The miniature variable focus lens and the camera that was developed to contain it. Photo: Philips.
Model Definition
The model consists of a sealed chamber with radius 1.5 mm filled with two immiscible liquids. Because the geometry is cylindrical, the axisymmetric geometry shown in Figure 3 can be used.
The lower fluid in Figure 3 is a conducting solution of lithium chloride, with a density of 1000 kg/m3 and a viscosity of 1.5 mPa·s. The upper fluid is insulating, with a matching density and a viscosity that is altered by varying its composition to optimize the camera performance. The surface tension at the interface between the two fluids is 50 mN/m.
The walls of the cylinder are coated with 3 μm of paylene N (relative dielectric constant, 2.65). Because this layer is thin it is not modeled explicitly in COMSOL and Equation 3 is used for the contact angle. The contact angle of the fluid in the absence of applied voltage is 140°. In this model the response of the fluid surface is modeled as a function of time after the voltage is switched from 100 V to 120 V.
It is desired to optimize the viscosity of the insulating fluid to achieve a fast response time for the switching of the lens, so the time dependent switching of the system is studied. Viscosities of 10 mPa·s, 30 mPa·s, and 50 mPa·s are investigated.
Figure 3: Axisymmetric model geometry.
Results and Discussion
When the voltage is switched the contact angle of the fluid changes abruptly but the system takes some time to respond to the change in the force at the contact point. The resonant modes of the interface are excited by this disturbance and, depending on the system damping, the oscillations of the interface take some time to decay. The higher order modes are damped out more rapidly than the fundamental mode, but are apparent in the plots shown in Figure 4 and Figure 5, which show the fluid velocity and pressure respectively 2 ms after the voltage is switched.
Figure 4: Fluid velocity magnitude (color) and direction (arrows) for a lens 2ms after the voltage is switched from 100 V to 120 V. The viscosity of the insulating fluid is 10 mPa·s.
Figure 5: Pressure in the fluid (color) and velocity of the boundary (arrows) for a lens 2 ms after the voltage is switched from 100 V to 120 V. The viscosity of the insulating fluid is 10 mPa·s.
Clearly for optimum performance of the lens, the oscillation of the meniscus should be damped out as rapidly as possible; the system should therefore be critically damped. Because the viscosity of the insulating fluid can be altered by changing its composition, it is possible to adjust the damping and hence to produce a lens with the fastest possible response time. Figure 6 shows the response of the system for three different values of the viscosity of the insulating fluid. From this plot it is clear that a viscosity of 50 mPa·s produces a system that is close to being critically damped.
Figure 6: Location of the center of the meniscus as a function of time for different values of the viscosity of the insulating fluid.
References
1. F. Mugele and J.-C. Baret, “Electrowetting: from basics to applications,” J. Phys. Condens. Matter, vol. 17, pp. R705–R774, 2005.
2. S. Kuiper and B.W. Hendriks, “Variable focus lens for miniature cameras,” Appl. Phys. Lett., vol. 85, no. 7, pp. 1128–1130, 2004. See also: http://www.research.philips.com/technologies/fluidfocus.html
Application Library path: Microfluidics_Module/Two-Phase_Flow/electrowetting_lens
Modeling Instructions
From the File menu, choose New.
New
In the New window, click  Model Wizard.
Model Wizard
1
In the Model Wizard window, click  2D Axisymmetric.
2
In the Select Physics tree, select Fluid Flow>Multiphase Flow>Two-Phase Flow, Moving Mesh>Laminar Two-Phase Flow, Moving Mesh.
3
Click Add.
4
Click  Study.
5
In the Select Study tree, select General Studies>Time Dependent.
6
Geometry 1
Define the model geometry.
1
In the Model Builder window, under Component 1 (comp1) click Geometry 1.
2
In the Settings window for Geometry, locate the Units section.
3
From the Length unit list, choose mm.
Rectangle 1 (r1)
1
In the Geometry toolbar, click  Rectangle.
2
In the Settings window for Rectangle, locate the Size and Shape section.
3
In the Width text field, type 1.5.
4
Click to expand the Layers section. In the table, enter the following settings:
Global Definitions
Parameters 1
1
In the Model Builder window, under Global Definitions click Parameters 1.
2
In the Settings window for Parameters, locate the Parameters section.
3
Define the contact angle according to Equation 3.
Definitions
Variables 1
1
In the Home toolbar, click  Variables and choose Local Variables.
2
In the Settings window for Variables, locate the Variables section.
3
Set up material properties.
Materials
Insulating fluid
1
In the Model Builder window, under Component 1 (comp1) right-click Materials and choose Blank Material.
2
In the Settings window for Material, type Insulating fluid in the Label text field.
3
Locate the Geometric Entity Selection section. Click  Clear Selection.
4
5
Locate the Material Contents section. In the table, enter the following settings:
Lithium chloride solution
1
Right-click Materials and choose Blank Material.
2
In the Settings window for Material, type Lithium chloride solution in the Label text field.
3
4
Locate the Material Contents section. In the table, enter the following settings:
Define the physics settings for the problem. Boundary conditions must be applied for both the moving mesh and the fluid flow.
Select the Fluid-Fluid Interface boundary condition for the two phase boundary.
Laminar Flow (spf)
Fluid-Fluid Interface 1
1
In the Model Builder window, under Component 1 (comp1) right-click Laminar Flow (spf) and choose Fluid Interface Features>Fluid-Fluid Interface.
2
3
In the Settings window for Fluid-Fluid Interface, locate the Surface Tension section.
4
From the Surface tension coefficient list, choose User defined. In the σ text field, type gamma.
Define the contact angle settings at the wall fluid interface.
Contact Angle 1
1
In the Model Builder window, expand the Fluid-Fluid Interface 1 node, then click Contact Angle 1.
2
In the Settings window for Contact Angle, locate the Contact Angle section.
3
In the θw text field, type theta.
4
Locate the Normal Wall Velocity section. Select the Constrain wall-normal velocity check box.
The Navier Slip option for the Wall boundary condition must be used in the moving mesh interface for a boundary on which a contact point moves. Use this condition for the wall on which the electrowetting effect occurs.
Wall 2
1
In the Physics toolbar, click  Boundaries and choose Wall.
2
3
In the Settings window for Wall, locate the Boundary Condition section.
4
From the Wall condition list, choose Navier slip.
Apply a Pressure Point Constraint so that the pressure is constrained.
Pressure Point Constraint 1
1
In the Physics toolbar, click  Points and choose Pressure Point Constraint.
2
Set up the mesh deformation boundary conditions.
Definitions
Symmetry/Roller 1
1
In the Definitions toolbar, click  Moving Mesh and choose Symmetry/Roller.
2
Quadrilateral elements are used for the mesh as they are typically stiffer and hence less susceptible to inverted elements than triangular elements. The mesh is also scaled at the contact point to improve the accuracy of the simulation.
Mesh 1
Scale 1
1
In the Mesh toolbar, click  Modify and choose Mesh>Scale.
2
In the Settings window for Scale, locate the Geometric Entity Selection section.
3
From the Geometric entity level list, choose Point.
4
5
Locate the Scale section. In the Element size scale text field, type 0.2.
Size
1
In the Model Builder window, click Size.
2
In the Settings window for Size, locate the Element Size section.
3
From the Calibrate for list, choose Fluid dynamics.
Free Quad 1
1
In the Mesh toolbar, click  Free Quad.
2
In the Settings window for Free Quad, click  Build All.
Define a nonlocal integration coupling that can be used to compute the height of the center of the meniscus above the base of the lens.
Definitions
Integration 1 (intop1)
1
In the Definitions toolbar, click  Nonlocal Couplings and choose Integration.
2
In the Settings window for Integration, locate the Source Selection section.
3
From the Geometric entity level list, choose Boundary.
4
5
Locate the Advanced section. Clear the Compute integral in revolved geometry check box.
Add a Parametric Sweep on the viscosity of the insulating fluid.
Study 1
Parametric Sweep
1
In the Study toolbar, click  Parametric Sweep.
2
In the Settings window for Parametric Sweep, locate the Study Settings section.
3
4
Solve the problem over an appropriate time interval.
Step 1: Time Dependent
1
In the Model Builder window, click Step 1: Time Dependent.
2
In the Settings window for Time Dependent, locate the Study Settings section.
3
In the Output times text field, type range(0,1e-3,5e-2).
4
In the Study toolbar, click  Compute.
Results
Velocity (spf)
Reproduce the plot shown in Figure 4. Note that to display the deformed geometry the plot should be viewed in the default spatial reference frame rather than in the material frame.
1
In the Settings window for 2D Plot Group, locate the Data section.
2
From the Time (s) list, choose 0.002.
3
From the Parameter value (muoil (Pa*s)) list, choose 0.01.
4
Locate the Plot Settings section. Select the x-axis label check box.
5
Select the y-axis label check box.
6
In the x-axis label text field, type r (mm).
7
In the y-axis label text field, type z (mm).
Arrow Surface 1
1
Right-click Velocity (spf) and choose Arrow Surface.
2
In the Settings window for Arrow Surface, locate the Coloring and Style section.
3
From the Color list, choose White.
4
In the Velocity (spf) toolbar, click  Plot.
5
Click the  Zoom Extents button in the Graphics toolbar.
Reproduce the plot shown in Figure 5.
Pressure (spf)
1
In the Model Builder window, click Pressure (spf).
2
In the Settings window for 2D Plot Group, locate the Data section.
3
From the Time (s) list, choose 0.002.
4
From the Parameter value (muoil (Pa*s)) list, choose 0.01.
5
Locate the Plot Settings section. Select the x-axis label check box.
6
Select the y-axis label check box.
7
In the x-axis label text field, type r (mm).
8
In the y-axis label text field, type z (mm).
Contour
1
In the Model Builder window, expand the Pressure (spf) node.
2
Right-click Contour and choose Delete. Click Yes to confirm.
Surface 1
1
In the Model Builder window, right-click Pressure (spf) and choose Surface.
2
In the Settings window for Surface, locate the Expression section.
3
In the Expression text field, type p.
Arrow Line 1
1
Right-click Pressure (spf) and choose Arrow Line.
2
In the Settings window for Arrow Line, locate the Coloring and Style section.
3
From the Color list, choose White.
4
In the Pressure (spf) toolbar, click  Plot.
5
Click the  Zoom Extents button in the Graphics toolbar.
2D Plot Group 4
1
In the Home toolbar, click  Add Plot Group and choose 2D Plot Group.
2
In the Settings window for 2D Plot Group, locate the Plot Settings section.
3
From the Frame list, choose Spatial  (r, phi, z).
Surface 1
1
Right-click 2D Plot Group 4 and choose Surface.
2
In the Settings window for Surface, locate the Expression section.
3
In the Expression text field, type spf.rho.
4
In the 2D Plot Group 4 toolbar, click  Plot.
Velocity, 3D (spf)
Reproduce the plot shown in Figure 6. The integration operator intop1(1) is used to integrate unity along the centerline of the lens, to compute the height of the meniscus as a function of time.
1D Plot Group 5
1
In the Home toolbar, click  Add Plot Group and choose 1D Plot Group.
2
In the Settings window for 1D Plot Group, locate the Data section.
3
From the Dataset list, choose Study 1/Parametric Solutions 1 (sol2).
4
Locate the Plot Settings section. Select the y-axis label check box.
5
In the associated text field, type Height of the meniscus (mm).
Global 1
1
Right-click 1D Plot Group 5 and choose Global.
2
In the Settings window for Global, locate the y-Axis Data section.
3
4
Locate the x-Axis Data section. From the Unit list, choose ms.
5
From the Axis source data list, choose Inner solutions.
6
In the 1D Plot Group 5 toolbar, click  Plot.