PDF

Thermal Bridges in Building Construction — 2D Composite Structure
Introduction
The European standard EN ISO 10211:2007 for thermal bridges in building constructions provides four test cases — two 2D and two 3D — for validating a numerical method (Ref. 1). If the values obtained by a method conform to the results of all these four cases, the method is classified as a three-dimensional steady-state high precision method.
COMSOL Multiphysics successfully passes all the test cases described by the standard. This document presents an implementation of the second 2D model (Case 2).
The example studies the temperature distribution and heat flux through a two-dimensional cross-section of an insulating wall. Table 1 and Table 2 compare the numerical results with the target solution provided by the standard.
Figure 1: Geometry and material distribution of ISO 10211:2007 test case 2.
Model Definition
Figure 1 shows the geometry and material distribution. Four materials with distinct thermal conductivities are used in the structure: a concrete layer on the top side, an aluminum layer on the left and bottom sides, an insulation material layer occupying the largest space in the structure, and a wooden batten between the aluminum and concrete layers.
The left and right boundaries are thermally insulated. The top and bottom boundaries, corresponding to cold exterior and hot interior sides, are subject to convective heat flux. The exterior temperature is 0°C while interior temperature is 20°C. The ISO 10211:2007 standard specifies the values of the thermal resistance, R, which is related to the heat transfer coefficient, h, according to
Results and Discussion
The temperature profile in Figure 2 shows the effects of the highly conductive aluminum layer on the left side.
Figure 2: Temperature distribution of ISO 10211:2007 test case 2.
The numerical results of the COMSOL Multiphysics simulation are compared with the expected values provided by EN ISO 10211:2007 (Ref. 1). Table 1 shows the comparison for the total heat flux and Table 2 compares temperature at nine particular points.
The maximum permissible differences to pass this case validation, 0.1°C for temperature and 0.1% for total heat flux, are respected.
Reference
1. European Committee for Standardization, EN ISO 10211, Thermal bridges in building construction – Heat flows and surface temperatures – Detailed calculations (ISO 10211:2007), Appendix A, pp. 30–36, 2007.
Application Library path: Heat_Transfer_Module/Buildings_and_Constructions/thermal_bridge_2d_composite_structure
Modeling Instructions
From the File menu, choose New.
New
In the New window, click  Model Wizard.
Model Wizard
1
In the Model Wizard window, click  2D.
2
In the Select Physics tree, select Heat Transfer>Heat Transfer in Solids (ht).
3
Click Add.
4
Click  Study.
5
In the Select Study tree, select General Studies>Stationary.
6
Global Definitions
Parameters 1
Define the parameters necessary to build the geometry.
1
In the Model Builder window, under Global Definitions click Parameters 1.
2
In the Settings window for Parameters, locate the Parameters section.
3
Geometry 1
Rectangle 1 (r1)
1
In the Geometry toolbar, click  Rectangle.
2
In the Settings window for Rectangle, locate the Size and Shape section.
3
In the Width text field, type W.
4
In the Height text field, type h3+h1.
5
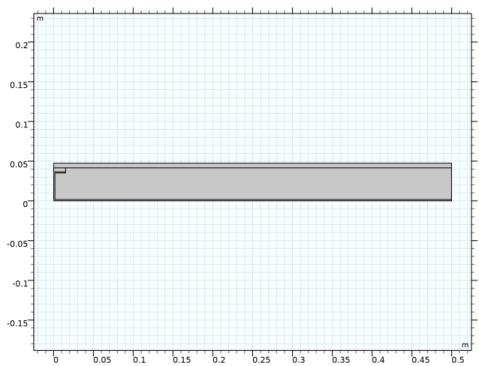
Click to expand the Layers section. In the table, enter the following settings:
6
Click  Build Selected.
This two-layered rectangle corresponds to the insulation and concrete layers. Continue with the aluminum layer, which consists of three rectangles.
Rectangle 2 (r2)
1
In the Geometry toolbar, click  Rectangle.
2
In the Settings window for Rectangle, locate the Size and Shape section.
3
In the Width text field, type W.
4
In the Height text field, type t4.
5
Click  Build Selected.
Rectangle 3 (r3)
1
In the Geometry toolbar, click  Rectangle.
2
In the Settings window for Rectangle, locate the Size and Shape section.
3
In the Width text field, type t4.
4
In the Height text field, type h4.
5
Click  Build Selected.
Rectangle 4 (r4)
1
In the Geometry toolbar, click  Rectangle.
2
In the Settings window for Rectangle, locate the Size and Shape section.
3
In the Width text field, type w.
4
In the Height text field, type t4.
5
Locate the Position section. In the y text field, type h4-t4.
6
Click  Build Selected.
Union 1 (uni1)
1
In the Geometry toolbar, click  Booleans and Partitions and choose Union.
2
In the Settings window for Union, locate the Union section.
3
Clear the Keep interior boundaries check box.
4
Click  Clear Selection.
5
Select the objects r2, r3, and r4 only.
6
Click  Build Selected.
Add a rectangle for the wooden batten.
Rectangle 5 (r5)
1
In the Geometry toolbar, click  Rectangle.
2
In the Settings window for Rectangle, locate the Size and Shape section.
3
In the Width text field, type w.
4
In the Height text field, type h2.
5
Locate the Position section. In the y text field, type h4.
6
Click  Build All Objects.
Materials
Concrete
1
In the Materials toolbar, click  Blank Material.
2
In the Settings window for Material, type Concrete in the Label text field.
3
4
Locate the Material Contents section. In the table, enter the following settings:
Wood
1
In the Materials toolbar, click  Blank Material.
2
In the Settings window for Material, type Wood in the Label text field.
3
4
Locate the Material Contents section. In the table, enter the following settings:
Insulation
1
In the Materials toolbar, click  Blank Material.
2
In the Settings window for Material, type Insulation in the Label text field.
3
4
Locate the Material Contents section. In the table, enter the following settings:
Aluminum
1
In the Materials toolbar, click  Blank Material.
2
In the Settings window for Material, type Aluminum in the Label text field.
3
4
Locate the Material Contents section. In the table, enter the following settings:
Heat Transfer in Solids (ht)
Heat Flux 1
1
In the Model Builder window, under Component 1 (comp1) right-click Heat Transfer in Solids (ht) and choose Heat Flux.
2
3
In the Settings window for Heat Flux, locate the Heat Flux section.
4
From the Flux type list, choose Convective heat flux.
5
In the h text field, type 1/0.11.
6
In the Text text field, type 20[degC].
Heat Flux 2
1
In the Physics toolbar, click  Boundaries and choose Heat Flux.
2
3
In the Settings window for Heat Flux, locate the Heat Flux section.
4
From the Flux type list, choose Convective heat flux.
5
In the h text field, type 1/0.06.
6
In the Text text field, type 0[degC].
Study 1
In the Home toolbar, click  Compute.
Results
Surface
The first default plot shows the temperature distribution (Figure 2).
1
In the Model Builder window, expand the Results>Temperature (ht) node, then click Surface.
2
In the Settings window for Surface, locate the Expression section.
3
From the Unit list, choose degC.
4
Click the  Zoom Extents button in the Graphics toolbar.
Isothermal Contours (ht)
The second default plot shows isothermal contours in the structure.
Follow the steps below to compute the heat flux given in Table 1.
Line Integration 1
1
In the Results toolbar, click  More Derived Values and choose Integration>Line Integration.
2
3
In the Settings window for Line Integration, click Replace Expression in the upper-right corner of the Expressions section. From the menu, choose Component 1 (comp1)>Heat Transfer in Solids>Boundary fluxes>ht.q0 - Inward heat flux - W/m².
4
Click  Evaluate.
Finally, export the temperature values at the points given in Table 2 to compare the results with the expected values.
Data 1
1
In the Results toolbar, click  Data and choose Data.
2
In the Settings window for Data, locate the Expressions section.
3
4
Locate the Output section. Click  Browse.
5
Browse to a suitable folder, enter the filename thermal_bridge_2d_composite_structure_result.txt, and then click Save.
6
From the Points to evaluate in list, choose Grid.
7
In the X text field, type 0,w,W.
8
In the Y text field, type 0,h4,h4+h2,h4+h2+h1.
9
Click Export.