PDF

Alkaline Electrolyzer
Introduction
Alkaline water electrolysis is a well-established industrial process for producing hydrogen gas. In the cell, hydrogen gas is formed at the cathode whereas oxygen gas is formed at the anode.
The electrolyte is an aqueous liquid, and when the evolved gases form bubbles, the effective ionic conductivity is lowered. The generated gases may have a detrimental effect on cell performance also due to a lowered accessible surface area for the electrode reactions.
This example investigates the impact of the gas formation on the performance of an alkaline electrolysis cell.
Model Definition
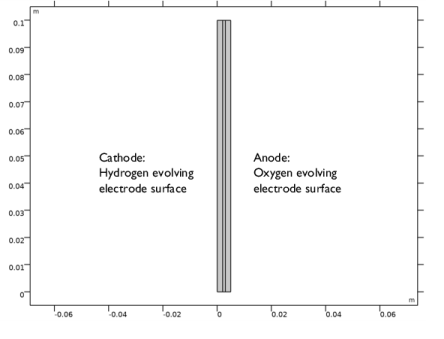
Figure 1 shows the model geometry. Electrolyte enters the cell from below, hydrogen and oxygen evolve on the two vertical electrode surfaces, with the gas/electrolyte mixtures exiting the cell at the top. An ion-conducting separator (diaphragm) separates the two electrolyte compartments
Figure 1: Model geometry.
The Water Electrolyzer interface is used in the model, which defines a current distribution model using Butler–Volmer kinetics on both electrodes.
On the negative cathode, hydrogen evolution occurs according to:
(1)
whereas on the positive anode, oxygen evolution occurs according to
(2)
A supporting electrolyte assumption is assumed for the electrolyte charge transport, assuming the liquid electrolyte conductivity not to change as a result of the electrode reactions. However, when gas evolution is introduced in the model, a correction of the effective electrolyte conductivity is made so that it depends on the gas volume fraction and the bulk electrolyte conductivity according to the Bruggeman correlation
(3)
where is the gas volume fraction. Also, when including gas evolution, the effective exchange current density for the electrode reactions depends on the local gas volume fraction according to
(4)
When including gas evolution, the Euler–Euler model is used in the electrolyte compartments, solving for the velocity vector in both the liquid and gas phases and the gas volume fraction. Gas and liquid mass flux boundary conditions are used on the electrodes surfaces, coupled to the current distribution model. At the separator boundaries, a liquid phase mass flux corresponding to ionic flux of OH- from the current distribution model is applied.
The gas properties and mass flow rates assume that the gases are fully humidified, considering the dew point at the operating temperature
In the Euler–Euler model, bubble dispersion (Ref. 1) is included in the momentum equations using a volume force according to
(5)
were ρl is the liquid phase density, Kg is a gas phase dispersion factor, db the bubble diameter, and uslip the slip velocity.
Results and Discussion
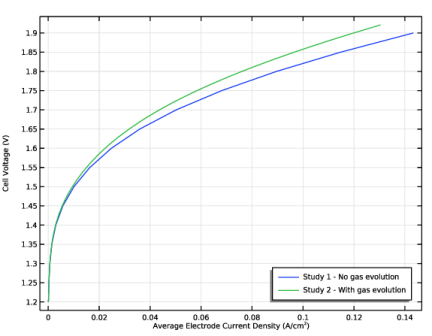
Figure 2 shows the polarization curves for the two cases of including and not including gas evolution in the model. Including gas evolution in the current distribution model indicates a small, but significant, polarization effect due to the generated bubbles.
Figure 2: Polarization curve comparison when including vs not including gas evolution.
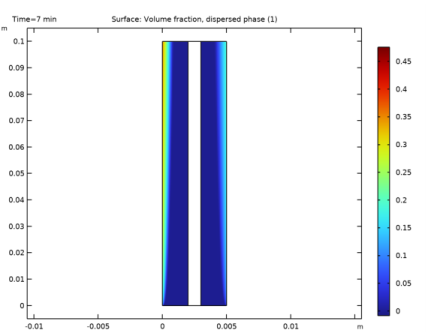
Figure 3 shows the gas volume fractions. Gas volume fractions increase towards the outlet. Due to the differences in reaction stoichiometries, more hydrogen than oxygen is generated.
Figure 3: Gas volume fraction at a cell voltage of 1.9 V. The hydrogen gas volume fraction (left) is higher than for oxygen (right).
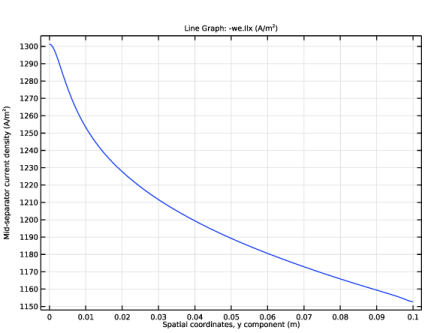
Figure 4 shows a line plot along the y direction in the middle of the separator of the electrolyte current density. At high cell polarization, the generated gas results in an approximately 15% difference in the y direction for the cross-separator electrolyte current density. This also implies a nonuniform utilization of the electrodes, which may lead to wear and shortened life for the cell.
Figure 4: Current distribution along a cut line placed in the middle of the separator at a cell voltage of 1.9 V.
Notes About the COMSOL Implementation
Study 1 does not solve for Euler–Euler, that is, it does not include two-phase effects.
At high cell voltages (gas evolution rates) vortices are formed, making it hard to converge to a stationary solution. Hence a time-dependent solver is used in Study 2, ramping up the voltage in time.
Reference
1. Le Bideau and others, “Eulerian Two-Fluid Model of Alkaline Water Electrolysis for Hydrogen Production,” Energies, vol. 13, p. 3394, 2020.
Application Library path: Fuel_Cell_and_Electrolyzer_Module/Electrolyzers/alkaline_electrolyzer
Modeling Instructions
This tutorial is divided into two steps. In the first step, a polarization curve for the water electrolyzer is simulated without the effect of the gas evolution. In the second step the gas evolution is considered, using the Euler-Euler interface. The polarization curves are then compared.
From the File menu, choose New.
New
In the New window, click  Model Wizard.
Model Wizard
1
In the Model Wizard window, click  2D.
2
In the Select Physics tree, select Electrochemistry>Water Electrolyzers>Hydroxide Exchange (we).
3
Click Add.
4
In the Select Physics tree, select Fluid Flow>Multiphase Flow>Euler-Euler Model>Euler-Euler Model, Laminar Flow (ee).
5
Click Add.
6
Click  Study.
7
In the Select Study tree, select Preset Studies for Selected Physics Interfaces>Water Electrolyzer>Stationary with Initialization.
8
Global Definitions
Parameters 1
Load the model parameters from a text file.
1
In the Model Builder window, under Global Definitions click Parameters 1.
2
In the Settings window for Parameters, locate the Parameters section.
3
Click  Load from File.
4
Geometry 1
Create the geometry as a union of three rectangles. By labeling the rectangles and enabling the Result objects selection checkbox, properly named selections are created that will be used later when setting up the physics.
Hydrogen Gas Compartment
1
In the Geometry toolbar, click  Rectangle.
2
In the Settings window for Rectangle, type Hydrogen Gas Compartment in the Label text field.
3
Locate the Size and Shape section. In the Width text field, type W_H2.
4
In the Height text field, type H_elec.
5
Locate the Selections of Resulting Entities section. Select the Resulting objects selection check box.
6
Click  Build Selected.
Separator
1
In the Geometry toolbar, click  Rectangle.
2
In the Settings window for Rectangle, type Separator in the Label text field.
3
Locate the Size and Shape section. In the Width text field, type W_sep.
4
In the Height text field, type H_elec.
5
Locate the Position section. In the x text field, type W_H2.
6
Locate the Selections of Resulting Entities section. Select the Resulting objects selection check box.
7
Click  Build Selected.
Oxygen Gas Compartment
1
In the Geometry toolbar, click  Rectangle.
2
In the Settings window for Rectangle, type Oxygen Gas Compartment in the Label text field.
3
Locate the Size and Shape section. In the Width text field, type W_O2.
4
In the Height text field, type H_elec.
5
Locate the Position section. In the x text field, type W_H2+W_sep.
6
Locate the Selections of Resulting Entities section. Select the Resulting objects selection check box.
Form Union (fin)
1
In the Model Builder window, right-click Form Union (fin) and choose Build Selected.
The final geometry should now look as follows:
Proceed to create some additional selections, that will also be used when setting up the physics later.
Hydrogen Electrode
1
In the Geometry toolbar, click  Selections and choose Explicit Selection.
2
In the Settings window for Explicit Selection, type Hydrogen Electrode in the Label text field.
3
Locate the Entities to Select section. From the Geometric entity level list, choose Boundary.
4
On the object fin, select Boundary 1 only.
Oxygen Electrode
1
In the Geometry toolbar, click  Selections and choose Explicit Selection.
2
In the Settings window for Explicit Selection, type Oxygen Electrode in the Label text field.
3
Locate the Entities to Select section. From the Geometric entity level list, choose Boundary.
4
On the object fin, select Boundary 10 only.
Inlets
1
In the Geometry toolbar, click  Selections and choose Explicit Selection.
2
In the Settings window for Explicit Selection, type Inlets in the Label text field.
3
Locate the Entities to Select section. From the Geometric entity level list, choose Boundary.
4
On the object fin, select Boundaries 2 and 8 only.
Outlets
1
In the Geometry toolbar, click  Selections and choose Explicit Selection.
2
In the Settings window for Explicit Selection, type Outlets in the Label text field.
3
Locate the Entities to Select section. From the Geometric entity level list, choose Boundary.
4
On the object fin, select Boundaries 3 and 9 only.
Separator Boundaries
1
In the Geometry toolbar, click  Selections and choose Explicit Selection.
2
In the Settings window for Explicit Selection, type Separator Boundaries in the Label text field.
3
Locate the Entities to Select section. From the Geometric entity level list, choose Boundary.
4
On the object fin, select Boundaries 4 and 7 only.
Electrodes
1
In the Geometry toolbar, click  Selections and choose Union Selection.
2
In the Settings window for Union Selection, type Electrodes in the Label text field.
3
Locate the Geometric Entity Level section. From the Level list, choose Boundary.
4
Locate the Input Entities section. Click  Add.
5
In the Add dialog box, in the Selections to add list, choose Hydrogen Electrode and Oxygen Electrode.
6
Gas Compartments
1
In the Geometry toolbar, click  Selections and choose Union Selection.
2
In the Settings window for Union Selection, type Gas Compartments in the Label text field.
3
Locate the Input Entities section. Click  Add.
4
In the Add dialog box, in the Selections to add list, choose Hydrogen Gas Compartment and Oxygen Gas Compartment.
5
Definitions
View 1
In the Model Builder window, expand the Component 1 (comp1)>Definitions node.
Axis
Change the scaling of the geometry in the graphics window. This is only for viewing purposes and has no other impact on the model.
1
In the Model Builder window, expand the View 1 node, then click Axis.
2
In the Settings window for Axis, locate the Axis section.
3
From the View scale list, choose Manual.
4
In the y scale text field, type 0.2.
5
Click  Update.
6
Click the  Zoom Extents button in the Graphics toolbar.
Add Material
1
In the Home toolbar, click  Add Material to open the Add Material window.
Add the electrolyte properties from the material library.
2
Go to the Add Material window.
3
In the tree, select Fuel Cell and Electrolyzer>Aqueous Alkali>Potassium Hydroxide, KOH.
4
Right-click and choose Add to Component 1 (comp1).
The gas phase properties will defined using built-in variables in the Water Electrolyzer interface and are not defined using Materials.
5
In the Home toolbar, click  Add Material to close the Add Material window.
Water Electrolyzer (we)
This model will not consider concentration gradients of the reactant gases. The gas mixtures are assumed to be humidified to a 100% relative humidity.
1
In the Settings window for Water Electrolyzer, locate the H2 Gas Mixture section.
2
Find the Transport mechanisms subsection. Clear the Include gas phase diffusion check box.
When specifying the electrode reaction, we will assume the electrolysis reactions proceed with liquid water as reactant (not water vapor). This will have an impact on the built-in calculation of the equilibrium potentials.
3
Find the Reactions subsection. Select the Include H2O(l) in reaction stoichiometry check box.
4
Locate the O2 Gas Mixture section. Find the Transport mechanisms subsection. Clear the Include gas phase diffusion check box.
5
Find the Reactions subsection. Select the Include H2O(l) in reaction stoichiometry check box.
H2 Gas Phase 1
1
In the Model Builder window, expand the Water Electrolyzer (we) node, then click H2 Gas Phase 1.
2
In the Settings window for H2 Gas Phase, locate the Composition section.
3
From the Mixture specification list, choose Humidified mixture.
4
In the Thum text field, type T.
5
In the pA,hum text field, type p_gas.
O2 Gas Phase 1
1
In the Model Builder window, click O2 Gas Phase 1.
2
In the Settings window for O2 Gas Phase, locate the Composition section.
3
From the Mixture specification list, choose Humidified mixture.
4
In the Thum text field, type T.
5
In the pA,hum text field, type p_gas.
Separator 1
1
In the Physics toolbar, click  Domains and choose Separator.
The effective electrolyte conductivity in the separator will be based on the bulk value for KOH in Materials, corrected for by the electrolyte volume fraction of the separator.
2
3
In the Settings window for Separator, locate the Effective Electrolyte Charge Transport section.
4
In the εl text field, type eps_sep.
H2 Gas-Electrolyte Compartment 1
1
In the Physics toolbar, click  Domains and choose H2 Gas-Electrolyte Compartment.
2
3
In the Settings window for H2 Gas-Electrolyte Compartment, locate the Domain Selection section.
4
From the Selection list, choose Hydrogen Gas Compartment.
O2 Gas-Electrolyte Compartment 1
1
In the Physics toolbar, click  Domains and choose O2 Gas-Electrolyte Compartment.
2
In the Settings window for O2 Gas-Electrolyte Compartment, locate the Domain Selection section.
3
From the Selection list, choose Oxygen Gas Compartment.
H2 Electrode Surface 1
1
In the Physics toolbar, click  Boundaries and choose H2 Electrode Surface.
2
In the Settings window for H2 Electrode Surface, locate the Boundary Selection section.
3
From the Selection list, choose Hydrogen Electrode.
H2 Electrode Reaction 1
1
In the Model Builder window, click H2 Electrode Reaction 1.
2
In the Settings window for H2 Electrode Reaction, locate the Stoichiometric Coefficients section.
3
In the νH2O text field, type 0.
4
In the νH2O(l) text field, type -1.
5
Locate the Electrode Kinetics section. In the i0,ref(T) text field, type i0_ref_H2.
O2 Electrode Surface 1
1
In the Physics toolbar, click  Boundaries and choose O2 Electrode Surface.
2
In the Settings window for O2 Electrode Surface, locate the Boundary Selection section.
3
From the Selection list, choose Oxygen Electrode.
4
Locate the Electrode Phase Potential Condition section. In the φs,ext text field, type E_cell.
O2 Electrode Reaction 1
1
In the Model Builder window, click O2 Electrode Reaction 1.
2
In the Settings window for O2 Electrode Reaction, locate the Stoichiometric Coefficients section.
3
In the νH2O text field, type 0.
4
In the νH2O(l) text field, type -1.
5
Locate the Electrode Kinetics section. In the i0,ref(T) text field, type i0_ref_O2.
Global Definitions
Default Model Inputs
Specify the default model inputs in the model. These are used by all physics nodes.
1
In the Model Builder window, under Global Definitions click Default Model Inputs.
2
In the Settings window for Default Model Inputs, locate the Browse Model Inputs section.
3
In the tree, select General>Concentration (mol/m^3) - minput.c.
The properties (density and viscosity) of the electrolyte are concentration dependent.
4
Find the Expression for remaining selection subsection. In the Concentration text field, type c_KOH.
5
In the tree, select General>Pressure (Pa) - minput.pA.
6
In the Pressure text field, type p_gas.
7
In the tree, select General>Temperature (K) - minput.T.
8
In the Temperature text field, type T.
Definitions
The model settings for the electrolyzer, excluding the effect of gas evolution, are now complete. Before solving, add a probe for the average cell current density. The probe will provide a scalar output for each step taken by the solver, and will be plotted while solving.
Boundary Probe 1 (bnd1)
1
In the Definitions toolbar, click  Probes and choose Boundary Probe.
2
In the Settings window for Boundary Probe, locate the Source Selection section.
3
From the Selection list, choose Oxygen Electrode.
4
Click Replace Expression in the upper-right corner of the Expression section. From the menu, choose Component 1 (comp1)>Water Electrolyzer>Electrode kinetics>we.iloc_o2er1 - Local current density - A/m².
5
Locate the Expression section. In the Table and plot unit field, type A/cm^2.
6
Select the Description check box.
7
In the associated text field, type Average cell current density.
Study 1 - No Gas Evolution
1
In the Model Builder window, click Study 1.
2
In the Settings window for Study, type Study 1 - No Gas Evolution in the Label text field.
Step 2: Stationary
1
In the Model Builder window, expand the Study 1 - No Gas Evolution node, then click Step 2: Stationary.
2
In the Settings window for Stationary, locate the Physics and Variables Selection section.
3
In the table, clear the Solve for check box for Euler-Euler Model, Laminar Flow (ee).
4
Click to expand the Study Extensions section. Select the Auxiliary sweep check box.
5
6
7
In the Home toolbar, click  Compute.
Results
Probe Plot Group 2
1
In the Model Builder window, under Results click Probe Plot Group 2.
2
In the Settings window for 1D Plot Group, locate the Plot Settings section.
3
Select the Flip the x- and y-axes check box.
4
Locate the Legend section. Clear the Show legends check box.
5
In the Probe Plot Group 2 toolbar, click  Plot.
Definitions
Now proceed to set up the gas evolution. First add some variable definitions from text files. Note that the different variable nodes should be selected on different domains and boundaries of the geometry.
Variables 1 - Hydrogen Gas Compartment
1
In the Model Builder window, expand the Component 1 (comp1) node.
2
Right-click Component 1 (comp1)>Definitions and choose Variables.
3
In the Settings window for Variables, type Variables 1 - Hydrogen Gas Compartment in the Label text field.
4
Locate the Geometric Entity Selection section. From the Geometric entity level list, choose Domain.
5
From the Selection list, choose Hydrogen Gas Compartment.
6
Locate the Variables section. Click  Load from File.
7
Variables 2 - Oxygen Gas Compartment
1
In the Model Builder window, right-click Definitions and choose Variables.
2
In the Settings window for Variables, type Variables 2 - Oxygen Gas Compartment in the Label text field.
3
Locate the Geometric Entity Selection section. From the Geometric entity level list, choose Domain.
4
From the Selection list, choose Oxygen Gas Compartment.
5
Locate the Variables section. Click  Load from File.
6
Variables 3 - Hydrogen Electrode
1
Right-click Definitions and choose Variables.
2
In the Settings window for Variables, type Variables 3 - Hydrogen Electrode in the Label text field.
3
Locate the Geometric Entity Selection section. From the Geometric entity level list, choose Boundary.
4
From the Selection list, choose Hydrogen Electrode.
5
Locate the Variables section. Click  Load from File.
6
Variables 4 - Oxygen Electrode
1
Right-click Definitions and choose Variables.
2
In the Settings window for Variables, type Variables 4 - Oxygen Electrode in the Label text field.
3
Locate the Geometric Entity Selection section. From the Geometric entity level list, choose Boundary.
4
From the Selection list, choose Oxygen Electrode.
5
Locate the Variables section. Click  Load from File.
6
Water Electrolyzer (we)
H2 Gas-Electrolyte Compartment 1
Similarly to the separator, the electrolyte-gas compartments should now use corrected electrolyte conductivity values, based on the electrolyte volume fraction. As gas evolves in the cell, the electrolyte volume fraction decreases.
1
In the Model Builder window, under Component 1 (comp1)>Water Electrolyzer (we) click H2 Gas-Electrolyte Compartment 1.
2
In the Settings window for H2 Gas-Electrolyte Compartment, locate the Effective Electrolyte Charge Transport section.
3
In the εl text field, type eps_liquid.
O2 Gas-Electrolyte Compartment 1
1
In the Model Builder window, click O2 Gas-Electrolyte Compartment 1.
2
In the Settings window for O2 Gas-Electrolyte Compartment, locate the Effective Electrolyte Charge Transport section.
3
In the εl text field, type eps_liquid.
H2 Electrode Reaction 1
Also the kinetics now gets affected by the gas volume fraction.
1
In the Model Builder window, under Component 1 (comp1)>Water Electrolyzer (we)>H2 Electrode Surface 1 click H2 Electrode Reaction 1.
2
In the Settings window for H2 Electrode Reaction, locate the Electrode Kinetics section.
3
In the i0,ref(T) text field, type i0_ref_H2*eps_liquid.
O2 Electrode Reaction 1
1
In the Model Builder window, under Component 1 (comp1)>Water Electrolyzer (we)>O2 Electrode Surface 1 click O2 Electrode Reaction 1.
2
In the Settings window for O2 Electrode Reaction, locate the Electrode Kinetics section.
3
In the i0,ref(T) text field, type i0_ref_O2*eps_liquid.
Euler-Euler Model, Laminar Flow (ee)
1
In the Model Builder window, under Component 1 (comp1) click Euler-Euler Model, Laminar Flow (ee).
2
In the Settings window for Euler-Euler Model, Laminar Flow, locate the Domain Selection section.
3
From the Selection list, choose Gas Compartments.
4
Locate the Physical Model section. From the Dispersed phase list, choose Liquid droplets/bubbles.
Phase Properties 1
1
In the Model Builder window, expand the Euler-Euler Model, Laminar Flow (ee) node, then click Phase Properties 1.
2
In the Settings window for Phase Properties, locate the Model Input section.
3
From the c list, choose Common model input.
The liquid phase properties are taken from KOH in Materials. The gas phase properties are taken from the built-in properties of the Water Electrolyzer interface.
4
Locate the Dispersed Phase Properties section. From the ρd list, choose Density of gas phase (we).
5
From the μd list, choose Dynamic viscosity of gas phase (we).
6
In the dd text field, type d_bubble.
Initial Values 1
1
In the Model Builder window, click Initial Values 1.
2
In the Settings window for Initial Values, locate the Initial Values section.
3
Specify the uc vector as
4
Specify the ud vector as
5
In the p text field, type g_const*1000[kg/m^3]*(H_elec-y).
Gravity 1
1
In the Physics toolbar, click  Domains and choose Gravity.
2
In the Settings window for Gravity, locate the Domain Selection section.
3
From the Selection list, choose All domains.
Volume Force - Bubble Dispersion
1
In the Physics toolbar, click  Domains and choose Volume Force.
2
In the Settings window for Volume Force, type Volume Force - Bubble Dispersion in the Label text field.
3
Locate the Volume Force section. Specify the Fc vector as
4
Specify the Fd vector as
5
Locate the Domain Selection section. From the Selection list, choose All domains.
Inlet 1
1
In the Physics toolbar, click  Boundaries and choose Inlet.
2
In the Settings window for Inlet, locate the Continuous Phase Boundary Condition section.
3
Specify the uc,0 vector as
4
Locate the Dispersed Phase Boundary Condition section. Specify the ud,0 vector as
5
From the Dispersed phase boundary condition list, choose No flux.
6
Locate the Boundary Selection section. From the Selection list, choose Inlets.
Outlet 1
1
In the Physics toolbar, click  Boundaries and choose Outlet.
2
In the Settings window for Outlet, locate the Boundary Selection section.
3
From the Selection list, choose Outlets.
Wall 2 - Electrodes
1
In the Physics toolbar, click  Boundaries and choose Wall.
2
In the Settings window for Wall, type Wall 2 - Electrodes in the Label text field.
3
Locate the Boundary Selection section. From the Selection list, choose Electrodes.
4
Locate the Continuous Phase Boundary Condition section. Select the Leakage check box.
5
In the mc text field, type m_liquid.
6
Locate the Dispersed Phase Boundary Condition section. From the Dispersed phase boundary condition list, choose Leakage.
7
In the md text field, type m_gas.
Wall 3 - Separator
1
In the Physics toolbar, click  Boundaries and choose Wall.
2
In the Settings window for Wall, type Wall 3 - Separator in the Label text field.
3
Locate the Boundary Selection section. From the Selection list, choose Separator Boundaries.
4
Locate the Continuous Phase Boundary Condition section. Select the Leakage check box.
5
In the mc text field, type m_OH.
The gas evolution polarization curve will be calculated using a time-dependent simulation, where the cell voltage is made time dependent using a ramp function.
Definitions
Ramp 1 (rm1)
In the Home toolbar, click  Functions and choose Local>Ramp.
Water Electrolyzer (we)
O2 Electrode Surface 1
1
In the Model Builder window, expand the Component 1 (comp1)>Water Electrolyzer (we) node, then click O2 Electrode Surface 1.
2
In the Settings window for O2 Electrode Surface, locate the Electrode Phase Potential Condition section.
3
In the φs,ext text field, type E_cell+rm1(t[1/min])*0.1[V].
Use a separate probe for the time-dependent simulation, with output to a separate table.
Definitions
Boundary Probe 2 (bnd2)
1
In the Model Builder window, under Component 1 (comp1)>Definitions right-click Boundary Probe 1 (bnd1) and choose Duplicate.
2
In the Settings window for Boundary Probe, click to expand the Table and Window Settings section.
3
Click  Add Table.
The gas evolution needs to be accurately resolved in the mesh close to the electrode boundaries. Set up the meshing sequence manually as follows:
Mesh 1
Distribution 1
1
In the Model Builder window, under Component 1 (comp1) right-click Mesh 1 and choose Distribution.
2
3
In the Settings window for Distribution, locate the Distribution section.
4
In the Number of elements text field, type 500.
Distribution 2
1
In the Model Builder window, right-click Mesh 1 and choose Distribution.
2
3
In the Settings window for Distribution, locate the Distribution section.
4
In the Number of elements text field, type 20.
Distribution 3
1
Right-click Mesh 1 and choose Distribution.
2
Given the rectangular shape of the geometry, a mapped mesh is suitable for this model.
Mapped 1
1
In the Mesh toolbar, click  Mapped.
2
In the Settings window for Mapped, click  Build Selected.
Add boundary layers in the mesh at the electrode surfaces as follows:
Boundary Layers 1
1
In the Mesh toolbar, click  Boundary Layers.
2
In the Settings window for Boundary Layers, click to expand the Transition section.
3
Clear the Smooth transition to interior mesh check box.
Boundary Layer Properties
1
In the Model Builder window, click Boundary Layer Properties.
2
In the Settings window for Boundary Layer Properties, locate the Boundary Selection section.
3
From the Selection list, choose Electrodes.
4
Locate the Layers section. From the Thickness specification list, choose First layer.
5
In the Thickness text field, type 1e-5.
6
Click  Build All.
Root
For the gas evolution simulation we will use a study sequence with several steps. The first two steps will calculate suitable initial values for the third time-dependent step.
Add Study
1
In the Home toolbar, click  Add Study to open the Add Study window.
2
Go to the Add Study window.
3
Find the Studies subsection. In the Select Study tree, select Preset Studies for Selected Physics Interfaces>Water Electrolyzer>Stationary with Initialization.
4
5
In the Home toolbar, click  Add Study to close the Add Study window.
Study 2 - Including Gas Evolution
In the Settings window for Study, type Study 2 - Including Gas Evolution in the Label text field.
Time Dependent
1
In the Study toolbar, click  Study Steps and choose Time Dependent>Time Dependent.
2
In the Settings window for Time Dependent, locate the Study Settings section.
3
From the Time unit list, choose min.
4
In the Output times text field, type range(0,1,7).
Modify the probe settings of the studies in order to not overwrite the probe output when not desired.
Step 2: Stationary
1
In the Model Builder window, click Step 2: Stationary.
2
In the Settings window for Stationary, click to expand the Results While Solving section.
3
From the Probes list, choose None.
Step 3: Time Dependent
1
In the Model Builder window, click Step 3: Time Dependent.
2
In the Settings window for Time Dependent, click to expand the Results While Solving section.
3
From the Probes list, choose Manual.
4
In the Probes list, select Boundary Probe 1 (bnd1).
5
Under Probes, click  Delete.
Study 1 - No Gas Evolution
Step 2: Stationary
1
In the Model Builder window, under Study 1 - No Gas Evolution click Step 2: Stationary.
2
In the Settings window for Stationary, locate the Results While Solving section.
3
From the Probes list, choose Manual.
4
In the Probes list, select Boundary Probe 2 (bnd2).
5
Under Probes, click  Delete.
Study 2 - Including Gas Evolution
In the Study toolbar, click  Compute.
Results
Polarization Plots
1
In the Model Builder window, under Results right-click Probe Plot Group 2 and choose Move Up.
2
In the Settings window for 1D Plot Group, type Polarization Plots in the Label text field.
3
Locate the Plot Settings section. Select the x-axis label check box.
4
In the associated text field, type Average Electrode Current Density (A/cm<sup>2</sup>).
5
Select the y-axis label check box.
6
7
Locate the Legend section. Select the Show legends check box.
8
From the Position list, choose Lower right.
Probe Table Graph 1
1
In the Model Builder window, expand the Polarization Plots node, then click Probe Table Graph 1.
2
In the Settings window for Table Graph, click to expand the Legends section.
3
From the Legends list, choose Manual.
4
Probe Table Graph 2
1
In the Model Builder window, click Probe Table Graph 2.
2
In the Settings window for Table Graph, click to expand the Preprocessing section.
3
Find the x-axis column subsection. From the Preprocessing list, choose Linear.
4
In the Scaling text field, type 0.1.
5
In the Shift text field, type E_cell.
6
Locate the Legends section. From the Legends list, choose Manual.
7
8
In the Polarization Plots toolbar, click  Plot.
Dispersed Phase (ee)
1
In the Model Builder window, under Results click Dispersed Phase (ee).
2
In the Dispersed Phase (ee) toolbar, click  Plot.
Create a cut-line data set in order to plot the electrolyte current density along a line in the middle of the separator.
Cut Line 2D 1
1
In the Results toolbar, click  Cut Line 2D.
2
In the Settings window for Cut Line 2D, locate the Data section.
3
From the Dataset list, choose Study 2 - Including Gas Evolution/Solution 3 (sol3).
4
Locate the Line Data section. In row Point 1, set x to W_cell/2.
5
In row Point 2, set x to W_cell/2.
6
In row Point 2, set y to H_elec.
7
Mid-separator Current Density
1
In the Results toolbar, click  1D Plot Group.
2
In the Settings window for 1D Plot Group, type Mid-separator Current Density in the Label text field.
3
Locate the Data section. From the Dataset list, choose Cut Line 2D 1.
4
From the Time selection list, choose Last.
5
Locate the Plot Settings section. Select the y-axis label check box.
6
In the associated text field, type Mid-separator current density (A/m<sup>2</sup>).
Line Graph 1
1
Right-click Mid-separator Current Density and choose Line Graph.
2
In the Settings window for Line Graph, locate the y-Axis Data section.
3
In the Expression text field, type -we.Ilx.
4
Locate the x-Axis Data section. From the Parameter list, choose Expression.
5
In the Expression text field, type y.
6
In the Mid-separator Current Density toolbar, click  Plot.
Electrolyte Potential (we)
In the Model Builder window, under Results right-click Electrolyte Potential (we) and choose Group.
Group 1 - Study 1
In the Settings window for Group, type Group 1 - Study 1 in the Label text field.
Continuous Phase (ee), Dispersed Phase (ee), Electrolyte Potential (we) 1, Mid-separator Current Density
1
In the Model Builder window, under Results, Ctrl-click to select Electrolyte Potential (we) 1, Continuous Phase (ee), Dispersed Phase (ee), and Mid-separator Current Density.
2
Group 2 - Study 2
In the Settings window for Group, type Group 2 - Study 2 in the Label text field.