PDF

Ibuprofen Synthesis
Introduction
Kinetic analysis of catalytic reactions is essential for understanding rate behavior as well as the reaction mechanism. Developing knowledge of intrinsic reaction kinetics and of rate equations is central to reaction engineering studies aimed at improving reactor design.
This example illustrates the reaction kinetics of a complex chemistry occurring in a perfectly stirred tank reactor. The homogeneous catalysis of 1-(4-isobutylphenyl) ethanol into the anti-inflammatory drug ibuprofen serves as the example chemistry. The model determines concentrations of reactants, intermediates, and products as functions of time for the network of chemical reactions.
The chemistry in this example involves homogeneous catalysis. As this terminology suggests, the catalyst and the reacting species are in the same phase. Most commonly, a liquid reaction mixture contains a soluble metalorganic complex that affects the catalysis. Organometallic catalysts can often be fine-tuned with respect to reaction activity and selectivity. Because these relatively expensive catalysts produce highly-refined reaction products, they commonly find application in fine chemicals or pharmaceutics.
The model focuses on the use of the Chemical Reaction Engineering Module for a kinetics investigation. You easily enter chemical reaction formulas from the keyboard, then the Reaction Engineering interface automatically generates rate expressions and material balances. It solves the equations, and you postprocess results directly in the COMSOL Desktop.
Model Description
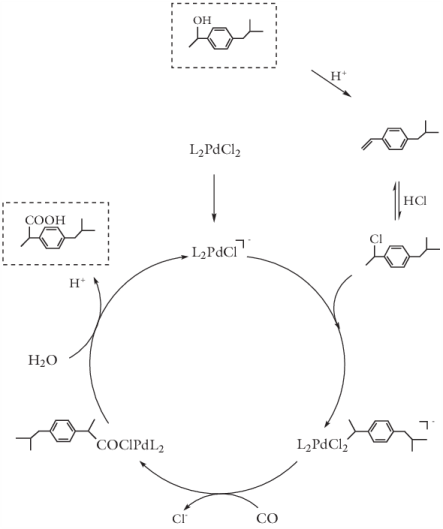
Analyzing chemical kinetics involves solving the set of ordinary differential equations corresponding to individual steps in a network of reactions. This example illustrates the kinetics of ibuprofen synthesis. Figure 1 shows the reaction steps displayed in a catalytic cycle (Ref. 1).
Figure 1: Catalytic cycle of ibuprofen synthesis.
Prior to entering the cycle, the starting material, 1-(4-isobutylphenyl)ethanol, is first dehydrated to form 4-isobutylstyrene. This species subsequently undergoes the addition of HCl to produce the active substrate 1-(4-isobutylphenyl)ethyl chloride. The palladium catalyst must also go through an initial transformation, from L2PdCl2 (L=triphenylphosphine) to anionic L2PdCl, before becoming active. The activated catalyst then assists in the carbonylation and hydrolysis of 1-(4-isobutylphenyl)ethyl chloride, producing ibuprofen.
The following reactions represent the catalytic cycle:
(1)
(2)
(3)
(4)
(5)
(6)
(7)
Reaction 1 involves the dehydration of the reactant alcohol to form the corresponding alkene. Reaction 2 describes the hydrohalogenation of alkene, resulting in the active substrate 1-(4-isobutylphenyl)ethyl chloride. Reaction 3 shows the dehydrohalogenation of the active substrate, assisted by a base, B. Reaction 4 describes the transformation of the precatalytic species L2PdCl2 into the active anionic catalyst L2PdCl. In Reaction 5 the active substrate undergoes oxidative addition to the L2PdCl catalyst. Reaction 6 summarizes the carbonylation, and Reaction 7 describes the hydrolysis of the metalorganic species, leading to the formation of ibuprofen and regeneration of the catalyst.
In order to make species notation more manageable, this example uses the following labels:
Making use of these notations, the reaction rates corresponding to Reaction 1 through Reaction 7 are:
(8)
(9)
(10)
(11)
(12)
(13)
(14)
The Reaction Engineering interface automatically generates these expressions and displays them immediately when you enter the chemical reaction formulas. By default, the software assumes that the chemistry takes place isothermally in a perfectly stirred batch reactor.
Figure 2: A perfectly stirred batch reactor where the reactant alcohol is carbonylated to form ibuprofen by means of palladium catalysis.
With no inflow or outflow from the reactor, the change of species concentrations with time is a function only of the reaction rates:
(15)
The Reaction Engineering automatically generates the mass balance in Equation 15 for each of the species, i, in the reactions, j, accounting for the stoichiometry in the reaction formulas, ν, and solves these equations.
The model investigates two reaction conditions. The first simulation (Case 1) solves for the seven reaction displayed previously. In Case 2 you modify the reaction network with an additional reaction, altering the simulation results. Assume that the reactant alcohol and product ibuprofen (a carboxylic acid) react reversibly, forming an ester:
The results of the two simulations are compared to gain insight in the process implications.
Results
Case 1
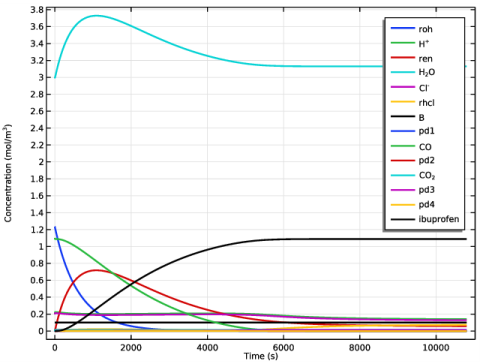
Figure 3 shows the concentration profiles for reactants and products over time.
Figure 3: Species concentrations (mol/m3) as a function of time (s).
Clearly, after approximately two hours the process has run to completion.
Case 2
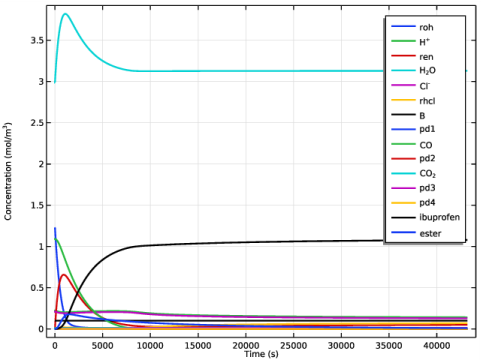
This expansion of the original case adds a reversible reaction between the reactant alcohol and the product ibuprofen to form an ester. Figure 4 shows the concentration transients.
Figure 4: Species concentrations (mol/m3) as a function of time (s).
In the course of the reaction, ester forms as an intermediary product. In order to achieve the same final concentration of ibuprofen for Case 2 as in Case 1, the process must run for at least 12 hours.
In conclusion, this example illustrates the use of the Chemical Reaction Engineering Module for analyzing the kinetics of a complex reaction network. When you enter the chemical-reaction formulas into the physics interface, the Reaction Engineering interface automatically sets up the corresponding rate expressions and material balances. You can modify simulation conditions effortlessly, for instance by activating/deactivating individual reactions or by changing initial conditions.
Reference
1. R.V. Chaudhari, A. Seayad, and S. Jayasree, “Kinetic modeling of homogeneous catalytic processes,” Catalysis Today, vol. 66, pp. 371–380, 2001.
Application Library path: Chemical_Reaction_Engineering_Module/Ideal_Tank_Reactors/ibuprofen_synthesis
Modeling Instructions
From the File menu, choose New.
New
In the New window, click  Model Wizard.
Model Wizard
1
In the Model Wizard window, click  0D.
2
In the Select Physics tree, select Chemical Species Transport>Reaction Engineering (re).
3
Click Add.
4
Click  Study.
5
In the Select Study tree, select General Studies>Time Dependent.
6
Global Definitions
Start by reading in a set of global parameters.
Parameters 1
1
In the Model Builder window, under Global Definitions click Parameters 1.
2
In the Settings window for Parameters, locate the Parameters section.
3
Click  Load from File.
4
First, set up the model for the first case.
Reaction Engineering (re)
1
In the Model Builder window, under Component 1 (comp1) click Reaction Engineering (re).
2
In the Settings window for Reaction Engineering, click to expand the Mixture Properties section.
3
From the Phase list, choose Liquid.
Reaction 1
1
In the Reaction Engineering toolbar, click  Reaction.
2
In the Settings window for Reaction, locate the Reaction Formula section.
3
In the Formula text field, type roh+H+=>ren+H2O+H+.
4
Locate the Rate Constants section. In the kf text field, type kreac_1.
Reaction 2
1
In the Reaction Engineering toolbar, click  Reaction.
2
In the Settings window for Reaction, locate the Reaction Formula section.
3
In the Formula text field, type ren+H++Cl-=>rhcl.
4
Locate the Rate Constants section. In the kf text field, type kreac_2.
Reaction 3
1
In the Reaction Engineering toolbar, click  Reaction.
2
In the Settings window for Reaction, locate the Reaction Formula section.
3
In the Formula text field, type rhcl+B=>ren+H++Cl-+B.
4
Locate the Rate Constants section. In the kf text field, type kreac_3.
Reaction 4
1
In the Reaction Engineering toolbar, click  Reaction.
2
In the Settings window for Reaction, locate the Reaction Formula section.
3
In the Formula text field, type pd1+CO+H2O=>pd2+Cl-+2H++CO2.
4
Locate the Rate Constants section. In the kf text field, type kreac_4.
Reaction 5
1
In the Reaction Engineering toolbar, click  Reaction.
2
In the Settings window for Reaction, locate the Reaction Formula section.
3
In the Formula text field, type pd2+rhcl=>pd3.
4
Locate the Rate Constants section. In the kf text field, type kreac_5.
Reaction 6
1
In the Reaction Engineering toolbar, click  Reaction.
2
In the Settings window for Reaction, locate the Reaction Formula section.
3
In the Formula text field, type pd3+CO=>pd4+Cl-.
4
Locate the Rate Constants section. In the kf text field, type kreac_6.
Reaction 7
1
In the Reaction Engineering toolbar, click  Reaction.
2
In the Settings window for Reaction, locate the Reaction Formula section.
3
In the Formula text field, type pd4+H2O=>pd2+H++ibu.
4
Locate the Rate Constants section. In the kf text field, type kreac_7.
Initial Values 1
1
In the Model Builder window, click Initial Values 1.
2
In the Settings window for Initial Values, locate the Volumetric Species Initial Values section.
3
Study 1
Run case 1 for three hours.
Step 1: Time Dependent
1
In the Model Builder window, under Study 1 click Step 1: Time Dependent.
2
In the Settings window for Time Dependent, locate the Study Settings section.
3
In the Output times text field, type 0 3600*3.
Solution 1 (sol1)
1
In the Study toolbar, click  Show Default Solver.
2
In the Model Builder window, expand the Solution 1 (sol1) node.
3
Right-click Study 1 and choose Compute.
4
Right-click Solution 1 (sol1) and choose Solution>Copy.
Save a copy of the solution for case 1.
Solution 1 - Case 1
1
In the Model Builder window, under Study 1>Solver Configurations click Solution 1 - Copy 1 (sol2).
2
In the Settings window for Solution, type Solution 1 - Case 1 in the Label text field.
Results
Concentration - Case 1
1
In the Model Builder window, under Results click Concentration (re).
2
In the Settings window for 1D Plot Group, type Concentration - Case 1 in the Label text field.
3
Locate the Data section. From the Dataset list, choose Study 1/Solution 1 - Case 1 (sol2).
4
Click to expand the Title section. From the Title type list, choose None.
Global 1
1
In the Model Builder window, expand the Concentration - Case 1 node, then click Global 1.
2
In the Settings window for Global, click to expand the Coloring and Style section.
3
In the Width text field, type 2.
4
Click to expand the Legends section. From the Legends list, choose Manual.
5
6
In the Concentration - Case 1 toolbar, click  Plot.
The plot in the Graphics window should look like that in Figure 3.
Continue with the model for case 2.
Reaction Engineering (re)
Reaction 8
1
In the Reaction Engineering toolbar, click  Reaction.
2
In the Settings window for Reaction, locate the Reaction Formula section.
3
In the Formula text field, type ibu+roh+H+<=>ester+H2O+H+.
4
Locate the Rate Constants section. In the kf text field, type kfreac_8.
5
In the kr text field, type krreac_8.
Study 1
Run case 2 for 12 hours.
Step 1: Time Dependent
1
In the Model Builder window, under Study 1 click Step 1: Time Dependent.
2
In the Settings window for Time Dependent, locate the Study Settings section.
3
In the Output times text field, type 0 3600*12.
4
In the Home toolbar, click  Compute.
Solution 1 (sol1)
Save a copy of the solution for case 2.
In the Model Builder window, under Study 1>Solver Configurations right-click Solution 1 (sol1) and choose Solution>Copy.
Solution 1 - Case 2
1
In the Model Builder window, under Study 1>Solver Configurations click Solution 1 - Copy 1 (sol3).
2
In the Settings window for Solution, type Solution 1 - Case 2 in the Label text field.
Results
Concentration - Case 2
1
In the Model Builder window, under Results click Concentration (re).
2
In the Settings window for 1D Plot Group, type Concentration - Case 2 in the Label text field.
3
Locate the Data section. From the Dataset list, choose Study 1/Solution 1 - Case 2 (sol3).
4
Locate the Title section. From the Title type list, choose None.
Global 1
1
In the Model Builder window, expand the Concentration - Case 2 node, then click Global 1.
2
In the Settings window for Global, locate the Coloring and Style section.
3
In the Width text field, type 2.
4
Locate the Legends section. From the Legends list, choose Manual.
5
6
In the Concentration - Case 2 toolbar, click  Plot.
Compare the plot in the Graphics window with that in Figure 4.