PDF

Capillary Filling — Phase Field Method
Introduction
Surface tension and wall adhesive forces are often used to transport fluid through microchannels in MEMS devices or to measure the transport and position of small amounts of fluid using micropipettes. Multiphase flow through a porous medium and droplets on solid walls are other examples where wall adhesion and surface tension strongly influence the dynamics of the flow.
This example studies a narrow vertical cylinder placed on top of a reservoir filled with water. Because of wall adhesion and surface tension at the air/water interface, water rises through the channel. The model calculates the velocity field, the pressure field, and the shape and position of the water surface.
This example demonstrates how to model the filling of a capillary channel using two multiphysics coupling features available in the CFD Module. You can use either the Two-Phase Flow, Level Set or the Two-Phase Flow, Phase Field multiphysics coupling features. The Level Set interface uses a reinitialized level set method to represent the fluid interface between the air and the water. The Phase Field interface, on the other hand, uses a Cahn-Hilliard equation, including a chemical potential to represent a diffuse interface separating the two phases. The Navier–Stokes equations are used to describe the momentum transport and the conservation of mass.
Model Definition
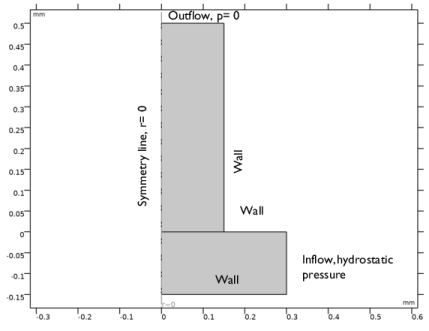
The model consists of a capillary channel of radius 0.15 mm attached to a water reservoir. Water can flow freely into the reservoir. Because both the channel and the reservoir are cylindrical, you can use the axisymmetric geometry illustrated in Figure 1. Initially, the thin cylinder is filled with air. Wall adhesion causes water to creep up along the cylinder boundaries. The deformation of the water surface induces surface tension at the air/water interface, which in turn creates a pressure jump across the interface. The pressure variations cause water and air to move upward. The fluids continue to rise until the capillary forces are balanced by the gravity force building up as the water rises in the channel. In the present example, the capillary forces dominate over gravity throughout the simulation. Consequently, the interface moves upward during the entire simulation.
Figure 1: Axisymmetric geometry with boundary conditions.
Representation and Convection of the Fluid Interface
Level Set Method
The Level Set interface automatically sets up the equations for the convection of the interface. The fluid interface is represented by the 0.5 contour of the level set function . In air and in water . The level set function can thus be thought of as the volume fraction of water. The transport of the fluid interface separating the two phases is given by
The ε parameter determines the thickness of the interface. When stabilization is used for the level set equation, you can typically use an interface thickness of ε = hc/2, where hc is the characteristic mesh size in the region passed by the interface. The γ parameter determines the amount of reinitialization. A suitable value for γ is the maximum velocity magnitude occurring in the model. The multiphysics coupling feature defines the density and viscosity according to:
Due to these definitions, the density and viscosity vary smoothly across the fluid interface. The delta function is approximated by
and the interface normal is calculated from
Phase Field Method
In the Phase Field interface the two-phase flow dynamics is governed by a Cahn-Hilliard equation. The equation tracks a diffuse interface separating the immiscible phases. The diffuse interface is defined as the region where the dimensionless phase field variable goes from 1 to 1. When solved in COMSOL Multiphysics, the Cahn-Hilliard equation is split up into two equations
where u is the fluid velocity (m/s), γ is the mobility (m3·s/kg), λ is the mixing energy density (N) and ε (m) is the interface thickness parameter. The ψ variable is referred to as the phase field help variable. The following equation relates the mixing energy density and the interface thickness to the surface tension coefficient:
You can typically set the interface thickness parameter to ε = hc/2, where hc is the characteristic mesh size in the region passed by the interface. The mobility parameter γ determines the time scale of the Cahn-Hilliard diffusion and must be chosen judiciously. It must be large enough to retain a constant interfacial thickness but small enough so that the convective terms are not overly damped. The default value, γ = ε2, is usually a good initial guess. This model uses a higher mobility to obtain the correct pressure variation over the interface.
In the Phase Field interface, the volume fractions of the individual fluids are
In the present model water is defined as Fluid 1 and air as Fluid 2.
The multiphysics coupling feature defines the density (kg/m3) and the viscosity (Pa·s) of the mixture to vary smoothly over the interface by letting
where the single phase water properties are denoted w and the air properties air.
Mass and Momentum Transport
The Navier–Stokes equations describe the transport of mass and momentum for fluids of constant density. In order to account for capillary effects, it is crucial to include surface tension in the model. The Navier–Stokes equations are then
Here, ρ denotes the density (kg/m3), μ equals the dynamic viscosity (Ns/m2), u represents the velocity (m/s), p denotes the pressure (Pa), and g is the gravity vector (m/s2). Fst is the surface tension force acting at the air/water interface.
Surface Tension
In the Level Set interface the surface tension force is computed as
Here, n is the interface normal, σ is the surface tension coefficient (N/m), is the curvature, and δ equals a Dirac delta function that is nonzero only at the fluid interface.
The following boundary force is added to enforce the contact angle:
(1)
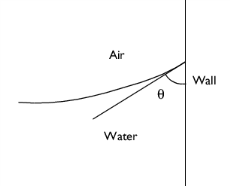
where θ is the contact angle (see Figure 2). If you apply a no slip boundary condition, the velocity vanishes on that boundary, and you cannot specify the contact angle. Instead, the interface remains fixed on the wall. However, if you allow a small amount of slip, it is possible to specify the contact angle. The Wetted Wall coupling feature adds the term given by Equation 1 and consequently makes it possible to set the contact angle.
In the Phase Field interface, the diffuse interface representation makes it possible to compute the surface tension by
where is the phase field parameter, and G is the chemical potential (J/m3)
As seen above, the phase field surface tension is computed as a distributed force over the interface using only ψ and the gradient of the phase field variable. This computation avoids using the surface normal and the surface curvature, which are troublesome to represent numerically.
Initial Conditions
Initially, the reservoir is filled with water and the capillary channel is filled with air. The initial velocity is zero.
Boundary Conditions
Inlet
The hydrostatic pressure, p = ρgz, gives the pressure at the inflow boundary. The pressure boundary condition automatically compensates for hydrostatic pressure so the actual value for the pressure is set to zero. Only water enters through the inlet, so the volume fraction of water is 1 here.
Outlet
At the outlet, the pressure is equal to zero, that is, equal to the pressure at the top of the inflow boundary. Because it is an outflow boundary, you do not have to set any condition on the level set function.
Walls
The Wetted Wall feature is suitable for solid walls in contact with a fluid interface. In the Level Set case, it is introduced as a multiphysics coupling feature that sets the velocity component normal to the wall to zero; that is,
and adds a frictional boundary force
Here, β is the slip length. The boundary condition also allows you to specify the contact angle θ, that is, the angle between the wall and the fluid interface (see Figure 2). In this example, the contact angle is 67.5° and the slip length equals the mesh element size, h.
Figure 2: Definition of the contact angle θ.
In the Phase Field simulation, one can combine the Wall feature under the Laminar Flow physics interface imposing a no slip condition for the velocity with the Wetted Wall feature under the Phase Field physics interface imposing the contact angle.
Results and Discussion
The initial development of the fluid interface is shown in Figure 3. During this stage the surface changes drastically in order for it to obtain the prescribed contact angle with the wall. When this is achieved, the surface tension imposed by the surface curvature begins to pull water up through the vertical cylinder. Due to the instantaneous start, the surface oscillates slightly during the rise.
Figure 3: Snapshots of the position of the interface during the first 0.15 ms. Level Set (left) and Phase Field (right) model results.
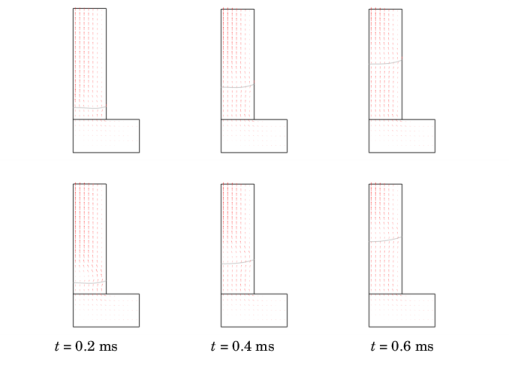
Figure 4 shows the interface and the velocity field at three different times following the initial stage. After about 0.6 ms the shape of the water surface remains approximately constant and forms a rising concave meniscus. Comparing the velocity field in the Level Set and the Phase Field models, the Level Set results display a small velocity near the wall/interface contact point, something that is not present in the Phase Field results. This is due to a difference in the wetted wall condition. The Level Set interface requires a wall slip length for the interface to move along the wall. As shown in Figure 4, the imposed slip velocity at the wall is small. In the Phase Field model a slip length is not necessary and the fluid velocity is truly zero on the wall.
Figure 4: Interface and velocity field at different times. Level Set (top) and Phase Field (bottom) model results.
Figure 5 shows surface plots of the pressure at t = 0.6 ms. At the fluid interface there is a pressure jump of roughly 300 Pa. The jump is caused by the surface tension and forces the water and air to rise through the vertical cylinder.
Figure 5: Pressure at t = 0.6 ms. Level Set (top) and Phase Field (bottom) model results.
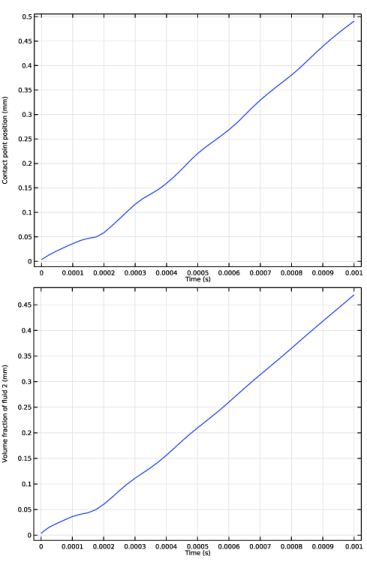
You can easily calculate the position of the interface/wall contact point by integrating the level set function along the thin cylinder wall. Figure 6 shows the position of the contact point as a function of time. The slight oscillations of the water surface noted above are seen here also in the contact point plot. The contact plots from the Level Set and Phase Field models compare very well, except for two minor points. The surface oscillation is a bit more pronounced in the Level Set model, and the surface endpoint is somewhat higher up in this case. Both these differences are small and are most likely related to the different implementations of the wetted wall boundary condition.
Figure 6: Position of the interface/wall contact point as a function of time. Level Set (top) and Phase Field (bottom) model result. The velocity is approximately constant after t = 0.6 ms.
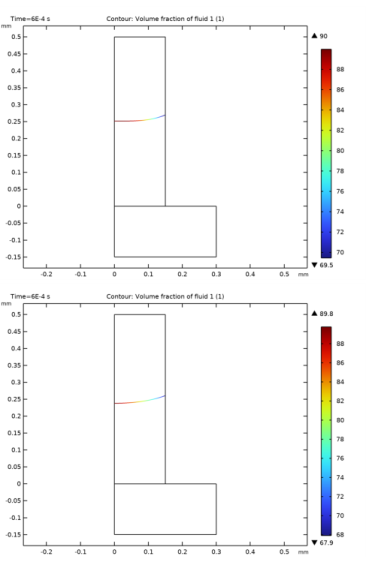
Finally, you can verify the obtained contact angle. It is defined by cosθ = nTnwall. In this case, the normal to the wall is nwall = er. The contact angle is thus θ = acos  nr, where nr is the radial component of the interface normal. Due to the slight oscillations of the surface, the contact angle varies during the rise. As Figure 7 shows, at t = 0.6 ms the contact angle is approximately 69° for the Level Set model and approximately 68° for the Phase Field model. Both results are close to the imposed contact angle of 3π/8 = 1.18 rad = 67.5°. The contact angle further approaches the imposed value if the mesh is refined.
Figure 7: Plot of acos(nr). At the wall, this gives the contact angle. In the Level Set model (top) the wall angle is approximately 69° and in the Phase Field model (bottom) it is approximately 68°.
Notes About the COMSOL Implementation
The model is straightforward to set up using either the Level Set or the Phase Field interface. At walls in contact with the fluid interface, you can use the Wetted Wall coupling feature for the Level Set case.
The simulation procedure consists of two steps. First the phase field and level set functions are initialized, then the time-dependent calculation starts. This is automatically set up by the software. You only need to specify appropriate times for the time-dependent analysis.
Application Library path: CFD_Module/Multiphase_Flow/capillary_filling_pf
Modeling Instructions
From the File menu, choose New.
New
In the New window, click  Model Wizard.
Model Wizard
1
In the Model Wizard window, click  2D Axisymmetric.
2
In the Select Physics tree, select Fluid Flow>Multiphase Flow>Two-Phase Flow, Phase Field>Laminar Flow.
3
Click Add.
4
Click  Study.
5
In the Select Study tree, select Preset Studies for Selected Multiphysics>Time Dependent with Phase Initialization.
6
Geometry 1
1
In the Model Builder window, under Component 1 (comp1) click Geometry 1.
2
In the Settings window for Geometry, locate the Units section.
3
From the Length unit list, choose mm.
Rectangle 1 (r1)
1
In the Geometry toolbar, click  Rectangle.
2
In the Settings window for Rectangle, locate the Size and Shape section.
3
In the Width text field, type 0.3.
4
In the Height text field, type 0.15.
5
Locate the Position section. In the z text field, type -0.15.
6
Click  Build Selected.
Rectangle 2 (r2)
1
In the Geometry toolbar, click  Rectangle.
2
In the Settings window for Rectangle, locate the Size and Shape section.
3
In the Width text field, type 0.15.
4
In the Height text field, type 0.5.
5
Click  Build Selected.
6
Click the  Zoom Extents button in the Graphics toolbar.
Form Union (fin)
1
In the Model Builder window, click Form Union (fin).
2
In the Settings window for Form Union/Assembly, click  Build Selected.
Add Material
1
In the Home toolbar, click  Add Material to open the Add Material window.
2
Go to the Add Material window.
3
4
Click Add to Component in the window toolbar.
5
In the tree, select Built-in>Water, liquid.
6
Click Add to Component in the window toolbar.
7
In the Home toolbar, click  Add Material to close the Add Material window.
Multiphysics
Two-Phase Flow, Phase Field 1 (tpf1)
1
In the Model Builder window, under Component 1 (comp1)>Multiphysics click Two-Phase Flow, Phase Field 1 (tpf1).
2
In the Settings window for Two-Phase Flow, Phase Field, locate the Fluid 1 Properties section.
3
From the Fluid 1 list, choose Air (mat1).
4
Locate the Fluid 2 Properties section. From the Fluid 2 list, choose Water, liquid (mat2).
Phase Field (pf)
Phase Field Model 1
1
In the Model Builder window, under Component 1 (comp1)>Phase Field (pf) click Phase Field Model 1.
2
In the Settings window for Phase Field Model, locate the Phase Field Parameters section.
3
In the χ text field, type 50.
4
In the εpf text field, type 6.5e-6.
Initial Values, Fluid 2
1
In the Model Builder window, click Initial Values, Fluid 2.
2
Laminar Flow (spf)
1
In the Model Builder window, under Component 1 (comp1) click Laminar Flow (spf).
2
In the Settings window for Laminar Flow, locate the Physical Model section.
3
Select the Include gravity check box.
Inlet 1
1
In the Physics toolbar, click  Boundaries and choose Inlet.
2
3
In the Settings window for Inlet, locate the Boundary Condition section.
4
Outlet 1
1
In the Physics toolbar, click  Boundaries and choose Outlet.
2
Phase Field (pf)
In the Model Builder window, under Component 1 (comp1) click Phase Field (pf).
Inlet 1
1
In the Physics toolbar, click  Boundaries and choose Inlet.
2
3
In the Settings window for Inlet, locate the Phase Field Condition section.
4
From the list, choose Fluid 2 (ϕ = 1).
Outlet 1
1
In the Physics toolbar, click  Boundaries and choose Outlet.
2
Wetted Wall 2
1
In the Physics toolbar, click  Boundaries and choose Wetted Wall.
2
3
In the Settings window for Wetted Wall, locate the Wetted Wall section.
4
In the θw text field, type (3*pi/8)[rad].
Next, define a variable for the contact angle.
Definitions
Variables 1
1
In the Home toolbar, click  Variables and choose Local Variables.
2
In the Settings window for Variables, locate the Variables section.
3
Mesh 1
Mapped 1
In the Mesh toolbar, click  Mapped.
Size
1
In the Model Builder window, click Size.
2
In the Settings window for Size, locate the Element Size section.
3
From the Calibrate for list, choose Fluid dynamics.
4
From the Predefined list, choose Extra fine.
5
Click  Build All.
Study 1
Step 2: Time Dependent
1
In the Model Builder window, under Study 1 click Step 2: Time Dependent.
2
In the Settings window for Time Dependent, locate the Study Settings section.
3
In the Output times text field, type range(0,0.25e-4,1e-3).
Solution 1 (sol1)
1
In the Study toolbar, click  Show Default Solver.
2
Click  Compute.
Results
Volume Fraction of Fluid 1 (pf)
The third default plot group shows the volume fraction of air. While the position of the air/water interface appears clearly, you can obtain an even sharper interface by plotting the 0.5 level of the same quantity using a filled contour plot, as in Figure 3.
Surface 1
1
In the Model Builder window, expand the Volume Fraction of Fluid 1 (pf) node.
2
Right-click Results>Volume Fraction of Fluid 1 (pf)>Surface 1 and choose Delete.
Volume Fraction of Fluid 1 (pf)
1
In the Model Builder window, under Results click Volume Fraction of Fluid 1 (pf).
2
Click Yes to confirm.
Contour 1
1
In the Model Builder window, click Contour 1.
2
In the Settings window for Contour, locate the Coloring and Style section.
3
From the Contour type list, choose Filled.
4
From the Coloring list, choose Color table.
5
From the Color table list, choose GrayScale.
6
Select the Color legend check box.
7
From the Legend type list, choose Line.
Volume Fraction of Fluid 1 (pf)
1
In the Model Builder window, click Volume Fraction of Fluid 1 (pf).
2
In the Settings window for 2D Plot Group, locate the Data section.
3
From the Time (s) list, choose 0.
4
In the Volume Fraction of Fluid 1 (pf) toolbar, click  Plot.
5
In the Model Builder window, click Volume Fraction of Fluid 1 (pf).
6
Click the Zoom Box button in the Graphics toolbar, then zoom in on the lower part of the capillary. Compare the resulting plot with that in the upper-right panel of Figure 3.
Velocity (spf)
The first default plot shows a surface plot of the velocity magnitude of the fluids. This plot can be changed to reproduce the combined velocity-field arrows and air/water-interface plot shown in Figure 4.
Surface
1
In the Model Builder window, expand the Velocity (spf) node.
2
Right-click Results>Velocity (spf)>Surface and choose Delete.
3
Click Yes to confirm.
Contour 1
1
In the Model Builder window, right-click Velocity (spf) and choose Contour.
2
In the Settings window for Contour, locate the Expression section.
3
In the Expression text field, type pf.Vf1.
4
Locate the Levels section. From the Entry method list, choose Levels.
5
In the Levels text field, type 0.5.
6
Locate the Coloring and Style section. From the Coloring list, choose Uniform.
7
From the Color list, choose Gray.
8
In the Velocity (spf) toolbar, click  Plot.
9
Click the  Zoom Extents button in the Graphics toolbar.
Arrow Surface 1
1
Right-click Velocity (spf) and choose Arrow Surface.
2
In the Settings window for Arrow Surface, locate the Arrow Positioning section.
3
Find the z grid points subsection. In the Points text field, type 30.
Velocity (spf)
1
In the Model Builder window, click Velocity (spf).
2
In the Settings window for 2D Plot Group, locate the Data section.
3
From the Time (s) list, choose 2E-4.
4
In the Velocity (spf) toolbar, click  Plot.
The resulting plot should closely resemble the upper-right plot in Figure 4.
Generate the remaining two plots by choosing the values 4e-4 and 6e-4 from the Time list.
Volume Fraction of Fluid 1 (pf) 1
The fifth default plot group shows the air/water-interface as an isosurface plot using a revolved dataset.
Edge 2D 1
1
In the Model Builder window, expand the Results>Views node.
2
Right-click Results>Datasets and choose Edge 2D.
3
Revolution 2D 3
1
In the Results toolbar, click  More Datasets and choose Revolution 2D.
2
In the Settings window for Revolution 2D, locate the Data section.
3
From the Dataset list, choose Edge 2D 1.
4
Click to expand the Revolution Layers section. In the Start angle text field, type -90.
5
In the Revolution angle text field, type 225.
Edge 2D 2
1
In the Results toolbar, click  More Datasets and choose Edge 2D.
2
Revolution 2D 4
1
In the Results toolbar, click  More Datasets and choose Revolution 2D.
2
In the Settings window for Revolution 2D, locate the Data section.
3
From the Dataset list, choose Edge 2D 2.
Volume Fraction of Fluid 1 (pf) 1
1
In the Model Builder window, expand the Results>Volume Fraction of Fluid 1 (pf) 1 node, then click Volume Fraction of Fluid 1 (pf) 1.
2
In the Settings window for 3D Plot Group, locate the Data section.
3
From the Dataset list, choose Revolution 2D.
4
From the Time (s) list, choose 3E-4.
5
Locate the Plot Settings section. Clear the Plot dataset edges check box.
6
In the Volume Fraction of Fluid 1 (pf) 1 toolbar, click  Plot.
Isosurface 1
1
In the Model Builder window, click Isosurface 1.
2
In the Settings window for Isosurface, locate the Data section.
3
From the Dataset list, choose Revolution 2D 1.
4
From the Time (s) list, choose 3E-4.
5
Locate the Coloring and Style section. From the Color list, choose White.
Surface 1
1
In the Model Builder window, right-click Volume Fraction of Fluid 1 (pf) 1 and choose Surface.
2
In the Settings window for Surface, locate the Expression section.
3
In the Expression text field, type pf.Vf1.
4
Locate the Coloring and Style section. From the Color table list, choose Cividis.
5
Locate the Data section. From the Dataset list, choose Revolution 2D.
6
From the Time (s) list, choose 3E-4.
7
In the Volume Fraction of Fluid 1 (pf) 1 toolbar, click  Plot.
Surface 2
1
Right-click Volume Fraction of Fluid 1 (pf) 1 and choose Surface.
2
In the Settings window for Surface, locate the Data section.
3
From the Dataset list, choose Revolution 2D 3.
4
Locate the Coloring and Style section. From the Coloring list, choose Uniform.
5
From the Color list, choose Gray.
Surface 3
1
Right-click Volume Fraction of Fluid 1 (pf) 1 and choose Surface.
2
In the Settings window for Surface, locate the Data section.
3
From the Dataset list, choose Revolution 2D 4.
4
Locate the Coloring and Style section. From the Coloring list, choose Uniform.
5
From the Color list, choose Gray.
6
In the Volume Fraction of Fluid 1 (pf) 1 toolbar, click  Plot.
Next, plot the pressure at t = 0.6 ms. Compare the result with the upper plot in Figure 5.
2D Plot Group 6
1
In the Home toolbar, click  Add Plot Group and choose 2D Plot Group.
2
In the Settings window for 2D Plot Group, locate the Data section.
3
From the Time (s) list, choose 6E-4.
Surface 1
1
Right-click 2D Plot Group 6 and choose Surface.
2
In the Settings window for Surface, locate the Expression section.
3
In the Expression text field, type p.
4
Locate the Coloring and Style section. From the Color table list, choose JupiterAuroraBorealis.
5
From the Color table transformation list, choose Reverse.
6
In the 2D Plot Group 6 toolbar, click  Plot.
7
Click the  Zoom Extents button in the Graphics toolbar.
Pressure Surface (spf)
1
In the Model Builder window, right-click 2D Plot Group 6 and choose Rename.
2
In the Rename 2D Plot Group dialog box, type Pressure Surface (spf) in the New label text field.
3
Go on to compute and plot the position of the interface/wall contact point.
Line Integration 1
1
In the Results toolbar, click  More Derived Values and choose Integration>Line Integration.
2
3
In the Settings window for Line Integration, locate the Expressions section.
4
5
Locate the Integration Settings section. Clear the Compute surface integral check box.
6
Click  Evaluate.
Table
1
Go to the Table window.
2
Click Table Graph in the window toolbar.
Results
Table Graph 1
Compare this graph with that in the lower panel of Figure 6.
Meniscus position
1
In the Model Builder window, right-click 1D Plot Group 7 and choose Rename.
2
In the Rename 1D Plot Group dialog box, type Meniscus position in the New label text field.
3
Finally, check the value of the contact angle at t = 0.6 ms (Figure 7).
2D Plot Group 8
1
In the Results toolbar, click  2D Plot Group.
2
In the Settings window for 2D Plot Group, locate the Data section.
3
From the Time (s) list, choose 6E-4.
Contour 1
1
Right-click 2D Plot Group 8 and choose Contour.
2
In the Settings window for Contour, locate the Expression section.
3
In the Expression text field, type pf.Vf1.
4
Locate the Levels section. From the Entry method list, choose Levels.
5
In the Levels text field, type 0.5.
Color Expression 1
1
Right-click Contour 1 and choose Color Expression.
2
In the Settings window for Color Expression, click Replace Expression in the upper-right corner of the Expression section. From the menu, choose Component 1 (comp1)>Definitions>Variables>theta - Contact angle.
Meniscus angle
1
In the Model Builder window, under Results click 2D Plot Group 8.
2
In the Settings window for 2D Plot Group, locate the Color Legend section.
3
Select the Show maximum and minimum values check box.
4
In the 2D Plot Group 8 toolbar, click  Plot.
At this instance the contact angle is approximately 68 degrees which can be found by expanding the Range section in the Settings Window of the Color Expression node created.
5
Right-click Results>2D Plot Group 8 and choose Rename.
6
In the Rename 2D Plot Group dialog box, type Meniscus angle in the New label text field.
7