PDF

Probe Tube Microphone
Introduction
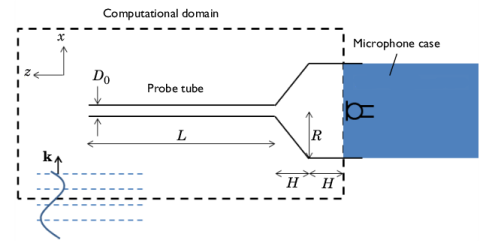
It is often not possible to insert a normal microphone directly into the sound field being measured. The microphone may be too big to fit inside the measured system, such as for in-the-ear measurements for hearing aid fitting. The size of the microphone may also be too large compared to the wavelength, so that it disturbs the acoustic field. In these cases, a probe tube may be attached to the microphone case (see the sketch in Figure 1) in order to distance the microphone from the measurement point. In this model, the microphone sensitivity change due to the addition of this small probe is investigated, see Ref. 1 (Chapter 4, pp. 160–162) for further details.
This is a time-dependent model of a generic probe tube microphone setup consisting of an external acoustic domain, an elastic probe tube, and the cavity in front of the microphone diaphragm; see the sketch in Figure 1. The probe tube, modeled using the Pipe Acoustics, Transient interface, is connected to two separate 3D pressure acoustics domains, leading to a fully coupled acoustics simulation.
Figure 1: Sketch of the probe tube microphone setup, consisting of a probe tube of length L and outer diameter D0. The tube is connected to a cavity (with the indicated dimensions) in front of the microphone diaphragm. An external sound field hits the probe tube with wave vector k.
Note: This application requires the Acoustics Module.
Model Definition
The probe tube microphone geometry and the computational domain considered in this model are shown schematically in Figure 1. From right to left, the model consists of the cavity in front of the microphone, which takes the form of a cylinder of radius R and height H connected to a cone of bottom radius R and top radius D0. D0 is also the outer diameter of the probe tube of length L. The probe is made of an elastic material with inner diameter 2dr = 2 mm and wall thickness dw = 0.3 mm. The tube material is set to have a Young’s modulus of 0.1 GPa and a Poisson’s ratio of 0.4.
Table 1 lists the model parameters,
1/f
2πf
c0
λmin
c0/f
2π/λmin
dr
dw
D0
2dr + 2dw = 2.6 mm
kD0
kD0 = 0.02
dvisc
A sinusoidal wave moving in the positive x direction is incident on the probe tube microphone. The wave with an amplitude of 1 Pa is given by
(1)
where ω is the angular frequency, and k is the wave number (these are given in Table 1). Such a plane monochromatic wave exists as a built-in option for the Incident Pressure Field feature in the interface. In the transient analysis, a ramp is automatically added to smoothly increase the background pressure field amplitude over the first period T = 1/f0. This is done to ensure numerical stability and can be deactivated under the Incident Pressure Field with the Advanced Physics Options turned on.
Modeled using the Pipe Acoustics, Transient interface, the long probe tube is treated as a1D structure. This assumption is valid as long as the interaction between the probe tube and the incoming sound field can be neglected. This, in turn, requires that kD0 << 1, which is true for the current choice of parameters because kD0 = 0.02; see Table 1.
Another important assumption is that there are no significant thermal and viscous boundary losses inside the probe tube. Also, this assumption holds for the current setup, where the incident field is a monochromatic wave. At a driving frequency of 500 Hz, the viscous boundary layer thickness inside the probe tube is of the order 0.1 mm, which is 10 times smaller than the internal radius dr. The thickness of the boundary layer is proportional to .
Because the diaphragm is not a fully rigid structure, assume it to have a resistive loss given by the impedance Z = 100·106 Ns/m5. This value is of the order of magnitude observed in common condenser microphones.
Results and Discussion
An important parameter of a probe tube extension to a microphone is the relation between the pressure at the tip and the pressure at the diaphragm (as measured by the microphone). This transfer function is necessary to calibrate the measurement system. The pressure at the tip of the probe and the pressure at the diaphragm are shown in Figure 2. After an initial transient, the solution becomes periodic after about 4 ms. Hereafter, the system has a gain of about 1.4 and a phase shift equal to . The gain and phase shift depend on the frequency content of the applied signal — in this case a pure harmonic tone of 500 Hz.
A full transfer function could be obtained, for example, by using a Gaussian pulse as the incident signal and then performing a Fourier transform of the signal. This requires resolving the frequency content with an appropriate mesh that would become very dense. Moreover, the model assumptions might not hold for the full range of frequencies.
Figure 3 depicts the pressure distribution in the xz-plane at the end of the time interval shown in Figure 2.
Figure 2: Pressure as function of time at the probes tip (green line) and at the microphone diaphragm (blue line).
Figure 3: Pressure distribution in the xz-plane at time t = 10 ms.
Notes About the COMSOL Implementation
Coupling between 1D and 3D domains
The Pipe Acoustics domain (probe domain) is connected to the first Pressure Acoustics domain (exterior domain) through a pressure condition at the pipe end. This manual coupling ensures continuity of the pressure between the pipe domain and the incident pressure field.
The Pipe Acoustics domain is connected to the second Pressure Acoustics domain (diaphragm cavity domain) through the Acoustics-Pipe Acoustics multiphysics coupling. This coupling guarantees continuity of pressure and velocity between both domains through the equations
(2)
(3)
where ppipe is the pipe pressure at the connection point, A is the total area of the connected acoustic boundary, pt is the total pressure in the acoustic domain, and S is the connected acoustic boundary. Furthermore, n is the vector normal to the boundary, qd is a dipole source, and upipe is the pipe velocity at the connection point.
Note: Further examples of coupling between 1D pipes and 3D domains are found in the tutorial model Acoustics of a Pipe System with 3D Bend and Junction, also available in the Application Gallery: www.comsol.com/model/acoustics-of-a-pipe-system-with-3d-bend-and-junction-40831.
Solver SETUP
The only adjustment needed to be done to the solver is to change it from using a segregated approach to using a fully coupled approach. The default logic in the study is to use segregated groups for physics that do not have a built-in multiphysics coupling. Here, the coupling is set up manually in one of the ends of the pipe. The settings for the transient solver are handled automatically by setting the Maximum frequency to resolve in the Transient Solver Settings section (as done in the instructions below.)
Reference
1. D.T. Blackstock, Fundamentals of Physical Acoustics, John Wiley & Sons, 2000.
Application Library path: Acoustics_Module/Tutorials,_Pipe_Acoustics/probe_tube_microphone
Modeling Instructions
From the File menu, choose New.
New
In the New window, click  Model Wizard.
Model Wizard
1
In the Model Wizard window, click  3D.
2
In the Select Physics tree, select Acoustics>Pipe Acoustics>Pipe Acoustics, Transient (patd).
3
Click Add.
4
In the Select Physics tree, select Acoustics>Pressure Acoustics>Pressure Acoustics, Transient (actd).
5
Click Add.
6
In the Select Physics tree, select Acoustics>Pressure Acoustics>Pressure Acoustics, Transient (actd).
7
Click Add.
8
Click  Study.
9
In the Select Study tree, select General Studies>Time Dependent.
10
Global Definitions
Parameters 1
1
In the Model Builder window, under Global Definitions click Parameters 1.
2
In the Settings window for Parameters, locate the Parameters section.
3
Click  Load from File.
4
Geometry 1
Next, define the geometry of the model. Either build the geometry by following the instructions at the end of the document or import the geometry from a sequence, and then jump to the Materials section. To import the geometry sequence, click Insert Sequence in the Geometry toolbar. Browse to the model’s Application Libraries folder and open the file probe_tube_microphone_geom_sequence.mph.
1
In the Geometry toolbar, click Insert Sequence and choose Insert Sequence.
2
3
In the Geometry toolbar, click  Build All.
Use the wireframe rendering to more easily see and access faces and lines inside the geometry.
4
Click the  Wireframe Rendering button in the Graphics toolbar.
5
Click the  Zoom Extents button in the Graphics toolbar.
The geometry should look like the figure below.
Add Material
1
In the Home toolbar, click  Add Material to open the Add Material window.
2
Go to the Add Material window.
3
4
Click Add to Component in the window toolbar.
5
6
Click Add to Component in the window toolbar.
7
In the Home toolbar, click  Add Material to close the Add Material window.
Materials
Air 1 (mat2)
1
In the Settings window for Material, locate the Geometric Entity Selection section.
2
From the Geometric entity level list, choose Edge.
3
Definitions
Average 1 (aveop1)
1
In the Definitions toolbar, click  Nonlocal Couplings and choose Average.
2
In the Settings window for Average, type aveop_mic in the Operator name text field.
3
Locate the Source Selection section. From the Geometric entity level list, choose Boundary.
4
Integration 1 (intop1)
1
In the Definitions toolbar, click  Nonlocal Couplings and choose Integration.
2
In the Settings window for Integration, type intop_tip in the Operator name text field.
3
Locate the Source Selection section. From the Geometric entity level list, choose Point.
4
Pipe Acoustics, Transient (patd)
Proceed to set up the physics of the problem. Select the domains where the different physics are applied and add the appropriate boundary conditions to couple these.
1
In the Model Builder window, under Component 1 (comp1) click Pipe Acoustics, Transient (patd).
2
In the Settings window for Pipe Acoustics, Transient, locate the Edge Selection section.
3
Click  Clear Selection.
4
Pipe Properties 1
1
In the Model Builder window, under Component 1 (comp1)>Pipe Acoustics, Transient (patd) click Pipe Properties 1.
2
In the Settings window for Pipe Properties, locate the Pipe Shape section.
3
4
In the di text field, type 2*dr.
5
Locate the Pipe Model section. From the Pipe model list, choose Anchored at one end.
6
From the E list, choose User defined. In the associated text field, type 0.1[GPa].
7
From the ν list, choose User defined. In the associated text field, type 0.4.
8
In the Δw text field, type dw.
9
In the Model Builder window, click Pipe Acoustics, Transient (patd).
10
In the Settings window for Pipe Acoustics, Transient, locate the Transient Solver Settings section.
11
In the fmax,sol text field, type f.
Pressure 1
1
In the Physics toolbar, click  Points and choose Pressure.
2
3
In the Settings window for Pressure, locate the Pressure section.
4
In the pin text field, type p2.
This manual coupling applies the pressure of the first Pressure Acoustics Domain into the Pipe Acoustics Domain.
Pressure Acoustics, Transient (actd)
1
In the Model Builder window, under Component 1 (comp1) click Pressure Acoustics, Transient (actd).
2
In the Settings window for Pressure Acoustics, Transient, locate the Domain Selection section.
3
Click  Clear Selection.
4
5
Locate the Transient Solver and Mesh Settings section. In the fmax,sol text field, type f.
Cylindrical Wave Radiation 1
1
In the Physics toolbar, click  Boundaries and choose Cylindrical Wave Radiation.
2
3
In the Settings window for Cylindrical Wave Radiation, locate the Cylindrical Wave Radiation section.
4
Specify the raxis vector as
Add an incident plane wave as defined in Equation 1 using the built-in Plane wave (monochromatic) option. The wave is automatically multiplied with a smoothing ramp function over the first period. This option can be seen by enabling the Advanced Physics Options view.
Incident Pressure Field 1
1
In the Physics toolbar, click  Attributes and choose Incident Pressure Field.
2
In the Settings window for Incident Pressure Field, locate the Incident Pressure Field section.
3
In the p0 text field, type 1.
4
From the c list, choose From material.
5
From the Material list, choose Air (mat1).
6
Specify the ek vector as
7
In the f0 text field, type f.
Pressure Acoustics, Transient 2 (actd2)
1
In the Model Builder window, under Component 1 (comp1) click Pressure Acoustics, Transient 2 (actd2).
2
In the Settings window for Pressure Acoustics, Transient, locate the Domain Selection section.
3
Click  Clear Selection.
4
5
Locate the Transient Solver and Mesh Settings section. In the fmax,sol text field, type f.
Impedance 1
1
In the Physics toolbar, click  Boundaries and choose Impedance.
2
3
In the Settings window for Impedance, locate the Impedance section.
4
In the Zi text field, type 100e6[N*s/m^5]*R^2*pi.
Multiphysics
Acoustic-Pipe Acoustic Connection 1 (apc1)
1
In the Physics toolbar, click  Multiphysics Couplings and choose Global>Acoustic-Pipe Acoustic Connection.
2
In the Settings window for Acoustic-Pipe Acoustic Connection, locate the Coupled Interfaces section.
3
From the Acoustics list, choose Pressure Acoustics, Transient 2 (actd2).
Selecting this second Pressure Acoustics domain is important, as otherwise the probe will have both ends connected to the same domain.
Mesh 1
Proceed and generate the mesh based on the Physics-controlled mesh suggestion. The frequency controlling the maximum element size is per default taken From study, that is, from the Maximum frequency to resolve. In general, 5 to 6 second-order elements per wavelength are needed to resolve the waves. For more details, see Meshing (Resolving the Waves) in the Acoustics Module User’s Guide. In this model, we use 10 elements per wavelength; the default Automatic is to have 5.
1
In the Model Builder window, under Component 1 (comp1) click Mesh 1.
2
In the Settings window for Mesh, locate the Pressure Acoustics, Transient (actd) section.
3
From the Number of mesh elements per wavelength list, choose User defined.
4
5
Locate the Pressure Acoustics, Transient 2 (actd2) section. From the Number of mesh elements per wavelength list, choose User defined.
6
7
Locate the Physics-Controlled Mesh section. From the Element size list, choose Coarse.
8
Locate the Sequence Type section. From the list, choose User-controlled mesh.
Size 1
1
In the Model Builder window, right-click Free Tetrahedral 1 and choose Size.
2
In the Settings window for Size, locate the Geometric Entity Selection section.
3
From the Geometric entity level list, choose Edge.
4
5
Locate the Element Size section. Click the Custom button.
6
Locate the Element Size Parameters section. Select the Maximum element size check box.
7
Size 2
1
Right-click Free Tetrahedral 1 and choose Size.
2
In the Settings window for Size, locate the Geometric Entity Selection section.
3
From the Geometric entity level list, choose Boundary.
4
5
Locate the Element Size section. Click the Custom button.
6
Locate the Element Size Parameters section. Select the Maximum element size check box.
7
8
Click  Build All.
Study 1
Step 1: Time Dependent
1
In the Model Builder window, under Study 1 click Step 1: Time Dependent.
2
In the Settings window for Time Dependent, locate the Study Settings section.
3
In the Output times text field, type range(0,T/25,5*T).
The data will be recorded for 5 periods (5*T) with a sampling of 25 points per period (increase the number of points to get better resolution in the stored solution).
Solution 1 (sol1)
1
In the Study toolbar, click  Show Default Solver.
2
In the Model Builder window, expand the Solution 1 (sol1) node.
3
In the Model Builder window, expand the Study 1>Solver Configurations>Solution 1 (sol1)>Time-Dependent Solver 1 node.
4
Right-click Study 1>Solver Configurations>Solution 1 (sol1)>Time-Dependent Solver 1 and choose Fully Coupled.
In this model, the coupling between the first Pressure Acoustics domain and the Pipe Acoustics Domain is set up manually. The default behavior, in the study, is for COMSOL to generate solver suggestions for the individual constituting physics (notice the tags) and sets up a segregated solver suggestion. This model is best solved using the fully coupled approach.
Now, solve the model and proceed to look at the results. First, look at the default plots and then create two custom plot groups. The model only takes a few seconds to solve.
5
In the Model Builder window, under Study 1>Solver Configurations>Solution 1 (sol1)>Time-Dependent Solver 1 click Fully Coupled 1.
6
In the Settings window for Fully Coupled, click  Compute.
Results
Acoustic Pressure (patd)
Acoustic Pressure (actd)
Acoustic Pressure, Isosurfaces (actd)
Acoustic Pressure (actd2)
Acoustic Pressure, Isosurfaces (actd2)
Follow the steps below to reproduce the plot in Figure 3.
3D Plot Group 7
In the Home toolbar, click  Add Plot Group and choose 3D Plot Group.
Slice 1
1
Right-click 3D Plot Group 7 and choose Slice.
2
In the Settings window for Slice, locate the Expression section.
3
In the Expression text field, type p2.
4
Locate the Plane Data section. From the Plane list, choose ZX-planes.
5
In the Planes text field, type 1.
6
Locate the Coloring and Style section. From the Color table list, choose Wave.
7
From the Scale list, choose Linear symmetric.
Slice 2
1
In the Model Builder window, right-click 3D Plot Group 7 and choose Slice.
2
In the Settings window for Slice, locate the Expression section.
3
In the Expression text field, type p3.
4
Locate the Plane Data section. From the Plane list, choose ZX-planes.
5
In the Planes text field, type 1.
6
Click to expand the Inherit Style section. From the Plot list, choose Slice 1.
Line 1
1
Right-click 3D Plot Group 7 and choose Line.
2
In the Settings window for Line, locate the Coloring and Style section.
3
From the Line type list, choose Tube.
4
In the Tube radius expression text field, type 0.5*patd.dh.
5
Select the Radius scale factor check box.
6
Click to expand the Inherit Style section. From the Plot list, choose Slice 1.
7
In the 3D Plot Group 7 toolbar, click  Plot.
Cross Sections
1
In the Model Builder window, under Results click 3D Plot Group 7.
2
In the Settings window for 3D Plot Group, type Cross Sections in the Label text field.
The figure should look like the one depicted in Figure 3.
1D Plot Group 8
In the Home toolbar, click  Add Plot Group and choose 1D Plot Group.
Global 1
1
Right-click 1D Plot Group 8 and choose Global.
2
In the Settings window for Global, locate the y-Axis Data section.
3
Pressure Profiles
1
In the Model Builder window, click 1D Plot Group 8.
2
In the Settings window for 1D Plot Group, locate the Plot Settings section.
3
Select the x-axis label check box.
4
Select the y-axis label check box.
5
6
In the 1D Plot Group 8 toolbar, click  Plot.
7
In the Label text field, type Pressure Profiles.
The figure should look like the one in Figure 2.
Appendix: Geometry Sequence Instructions
If you want to create the geometry yourself, follow these steps.
From the File menu, choose New.
New
In the New window, click  Model Wizard.
Model Wizard
1
In the Model Wizard window, click  3D.
2
Global Definitions
Parameters 1
1
In the Model Builder window, under Global Definitions click Parameters 1.
2
In the Settings window for Parameters, locate the Parameters section.
3
Geometry 1
Cone 1 (cone1)
1
In the Geometry toolbar, click  Cone.
2
In the Settings window for Cone, locate the Size and Shape section.
3
In the Bottom radius text field, type R.
4
In the Height text field, type H.
5
In the Top radius text field, type dr+dw.
Cylinder 1 (cyl1)
1
In the Geometry toolbar, click  Cylinder.
2
In the Settings window for Cylinder, locate the Size and Shape section.
3
In the Radius text field, type R.
4
In the Height text field, type H.
5
Locate the Position section. In the z text field, type -H.
Polygon 1 (pol1)
1
In the Geometry toolbar, click  More Primitives and choose Polygon.
2
In the Settings window for Polygon, locate the Coordinates section.
3
From the Data source list, choose Vectors.
4
In the x text field, type 0 0.
5
In the y text field, type 0 0.
6
In the z text field, type H H+L.
Cylinder 2 (cyl2)
1
In the Geometry toolbar, click  Cylinder.
2
In the Settings window for Cylinder, locate the Size and Shape section.
3
In the Radius text field, type 10[mm].
4
In the Height text field, type 35[mm].
5
Locate the Position section. In the z text field, type -H.
Work Plane 1 (wp1)
1
In the Geometry toolbar, click  Work Plane.
2
In the Settings window for Work Plane, locate the Plane Definition section.
3
From the Plane type list, choose Face parallel.
4
On the object cone1, select Boundary 4 only.
Work Plane 1 (wp1)>Plane Geometry
In the Model Builder window, click Plane Geometry.
Work Plane 1 (wp1)>Circle 1 (c1)
1
In the Work Plane toolbar, click  Circle.
2
In the Settings window for Circle, locate the Size and Shape section.
3
In the Radius text field, type dr.
4
Click to expand the Layers section.
Form Union (fin)
In the Home toolbar, click  Build All.