Ambient Variables and Conditions
The observed values are processed by computing weighted means, standard deviations, maximum, and minimum, to define different conditions for the temperature, dew point temperature, and wind speed.
Conditions of Temperature
where:
<Tstation> (SI unit: K) is the weighted mean of the observed values of temperature at the station.
σT,station (SI unit: K) is the standard deviation of the observed values of temperature at the station.
Tstation (SI unit: K) is the set of the observed values of temperature at the station.
cσ (dimensionless) is a user-defined multiplicative coefficient applied to σT,station.
ΔT (SI unit: K) is a user-defined additive correction applied to <Tstation>.
All these conditions are illustrated on Figure 3-5 for the variation of temperature over 1 day at New York/John F. Ke, on the 1st of June.
Figure 3-5: Comparison of ambient conditions for the temperature at New York/John F. Ke, on the 1st of June, with ASHRAE Weather Data Viewer 5.0 (©2013 ASHRAE, www.ashrae.org. Used with permission.)
Additional conditions are defined from observed couples of temperature and wind speed and direction values:
where ΔTwind (SI unit: K) is an additive correction applied to <Tstation>, defined as
where ΔTws,station (SI unit: K) and ΔTwd,station (SI unit: K) are respectively the maximal variations of observed values of temperature correlated with a set of wind speed and direction observed values.
The heating and cooling wind correlations are illustrated on Figure 3-6 for the variation of temperature over 1 day, at New York/John F. Ke, on the 1st of June.
Figure 3-6: Comparison of heating and cooling wind correlations for the temperature at New York/John F. Ke, on the 1st of June, with ASHRAE Weather Data Viewer 5.0 (©2013 ASHRAE, www.ashrae.org. Used with permission.)
Conditions of Dew Point Temperature
where:
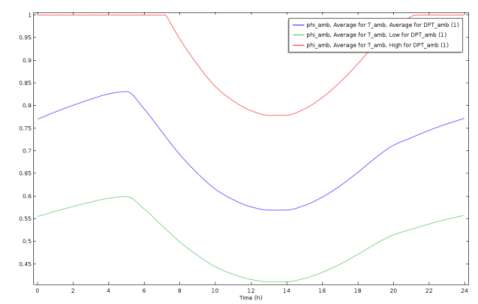
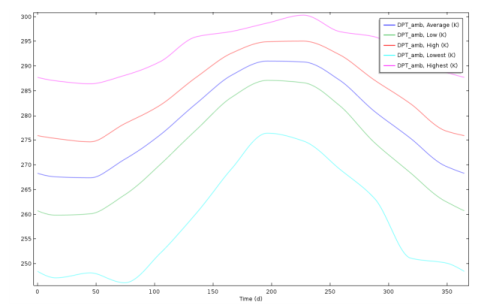
<DPTstation> (SI unit: K) is the weighted mean of the observed values of dew point temperature at the station.
σDPT,station (SI unit: K) is the standard deviation of the observed values of dew point temperature at the station.
DPTstation (SI unit: K) is the set of the observed values of dew point temperature at the station.
All these conditions are illustrated on Figure 3-7 for the variation of the dew point temperature over 1 year at New York/John F. Ke.
Figure 3-7: Comparison of the ambient conditions for the dew point temperature at New York/John F. Ke, with ASHRAE Weather Data Viewer 5.0 (©2013 ASHRAE, www.ashrae.org. Used with permission.)
Conditions of Wind Speed
where:
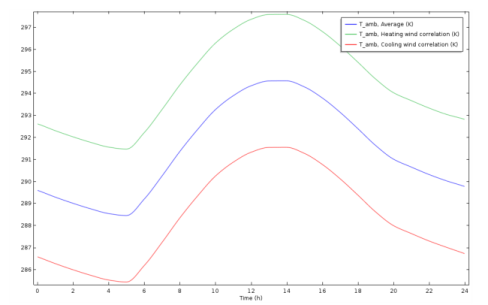
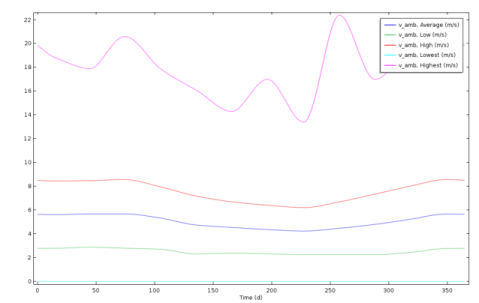
<vstation> (SI unit: m/s) is the weighted mean of the observed values of wind velocity at the station.
σv,station (SI unit: m/s) is the standard deviation of the observed values of wind velocity at the station.
vstation (SI unit: m/s) is the set of the observed values of wind velocity at the station.
All these conditions are illustrated on Figure 3-8 for the variation of the wind speed over 1 year at New York/John F. Ke.
Figure 3-8: Comparison of the ambient conditions for the wind speed at New York/John F. Ke, with ASHRAE Weather Data Viewer 5.0 (©2013 ASHRAE, www.ashrae.org. Used with permission.)
Conditions of Precipitation Rate
where:
<P0,station> (SI unit: m/s) is the weighted mean of the observed values of precipitation rate at the station.
σP0,station (SI unit: m/s) is the standard deviation of the observed values of precipitation rate at the station.
P0,station (SI unit: m/s) is the set of the observed values of precipitation rate at the station.
Pressure
where pstation (SI unit: Pa) is the observed value of absolute pressure at the station. Only a single value is available, so this data does not vary with time.
Relative Humidity
The relative humidity (dimensionless) is computed from the temperature Tamb and the dew point temperature DPTamb with the following relation:
where psat(Tamb) is the saturation pressure of vapor at Tamb.
See Relative Humidity for more details.
As the diurnal variation of temperature is available, the diurnal fluctuations of relative humidity can be computed, as illustrated on Figure 3-9 for New York/John F. Ke, on the 1st of June, for different ambient conditions.
Figure 3-9: Diurnal fluctuations of relative humidity for different ambient conditions at New York/John F. Ke, on the 1st of June, with ASHRAE Weather Data Viewer 5.0 (©2013 ASHRAE, www.ashrae.org. Used with permission.)
Several conditions of relative humidity can be obtained from the selection of conditions for the temperature and dew point temperature. For consistency, the relative humidity is majored by 1, as shown on the red curve of Figure 3-9.
Moisture Content
The moisture content xvap,amb (dimensionless) is computed from the temperature Tamb, the absolute pressure pamb, and the relative humidity with the following relation:
where psat(Tamb) is the saturation pressure of vapor at Tamb, and Mv and Ma are the molar masses of water vapor and dry air.
See Moisture Content for more details.
Direct and Diffuse Solar Irradiances
With clear sky conditions, the noon solar irradiance is essentially provided by the beam normal irradiance, coming directly from the sun. However, the diffuse horizontal irradiance may be also considered. The sum of direct and diffuse solar irradiances is the ambient solar irradiance Is, amb (SI unit: W/m3), defined by:
where Isn,station (SI unit: W/m3) and Ish,station (SI unit: W/m3) are respectively the observed values of the clear sky noon beam normal and horizontal diffuse solar irradiances.
Figure 3-10 illustrates the evolution of ambient solar irradiance for New York/John F. Ke, over the year.
Figure 3-10: Decomposition of solar irradiance into normal and horizontal irradiance at New York/John F. Ke, with ASHRAE Weather Data Viewer 5.0 (©2013 ASHRAE, www.ashrae.org. Used with permission.)