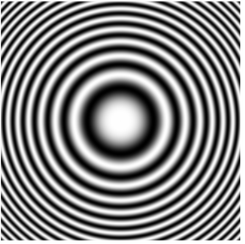
The pattern of fringes resulting from the interference of two or more rays can be plotted using the dedicated Interference Pattern plot. The Interference Pattern plot is available in 2D plot groups and requires a
Cut Plane dataset pointing to a
Ray dataset. The interference pattern is then plotted using the locations and properties of rays as they intersect the cut plane.
The Interference Pattern can only be plotted if the ray intensity and phase are solved for; in the physics interface settings, select an appropriate intensity computation method from the
Intensity computation list, then select the
Compute phase check box.