Ray Trajectories Plot
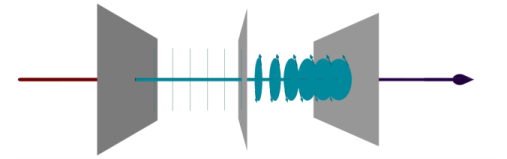
The default Ray Trajectories plot shows each ray as a line, ribbon, or tube. The final ray position can be rendered as a point or vector. It is also possible to modify the Ray Trajectories plot by adding the Color Expression, Deformation, or Filter attributes.
As an example, when the ray intensity is computed, you can also plot polarization ellipses along the ray paths, using the built-in variables (gop.pax, gop.pay,gop.paz) for the semi-major axis and (gop.pbx, gop.pby,gop.pbz) for the semi-minor axis.
Figure 2-3: Polarization ellipses as a ray crosses a linear polarizer, linear wave retarder, and a second linear polarizer.
Linear Wave Retarder: Application Library path Ray_Optics_Module/Tutorials/linear_wave_retarder