|
|
|
|
1
|
|
2
|
In the Select Physics tree, select Optics>Wave Optics>Electromagnetic Waves, Frequency Domain (ewfd).
|
|
3
|
Click Add.
|
|
4
|
Click
|
|
5
|
|
6
|
Click
|
|
1
|
|
2
|
|
1
|
|
2
|
|
3
|
|
1
|
|
2
|
|
3
|
|
4
|
|
5
|
|
6
|
|
1
|
|
2
|
|
3
|
|
4
|
|
5
|
|
6
|
|
7
|
|
1
|
|
2
|
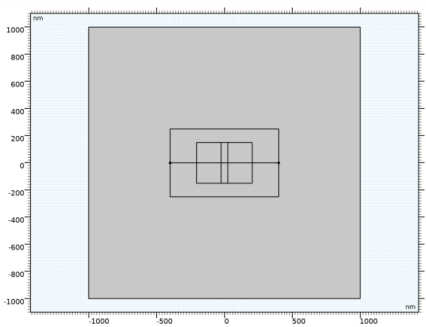
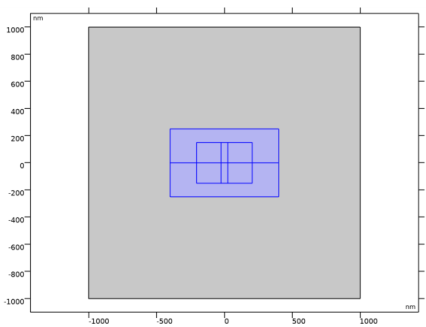
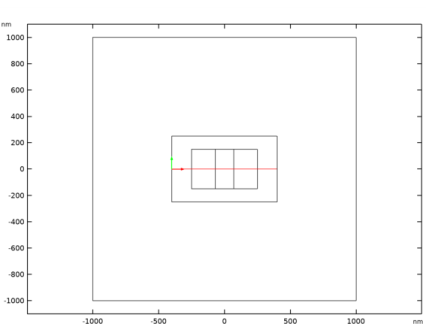
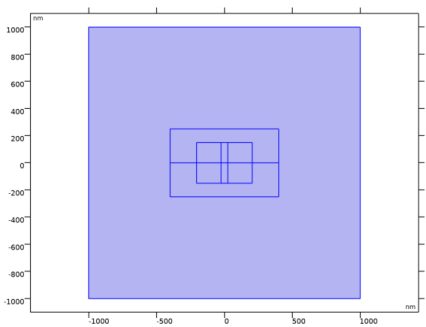
Select the object r2 only.
|
|
3
|
|
4
|
|
5
|
|
6
|
|
1
|
|
2
|
|
3
|
|
4
|
|
5
|
|
6
|
|
7
|
|
1
|
|
2
|
|
3
|
|
4
|
|
5
|
|
6
|
|
1
|
|
2
|
|
3
|
|
4
|
|
5
|
|
6
|
|
7
|
|
1
|
|
2
|
|
3
|
|
1
|
|
2
|
|
1
|
|
2
|
Click in the Graphics window and then press Ctrl+A to select all domains.
|
|
3
|
In the Settings window for Integration, type Integration 2 (Complete Waveguide) in the Label text field.
 |
|
1
|
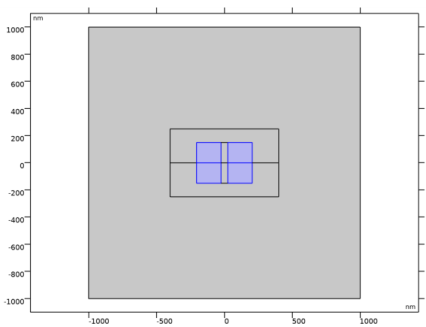
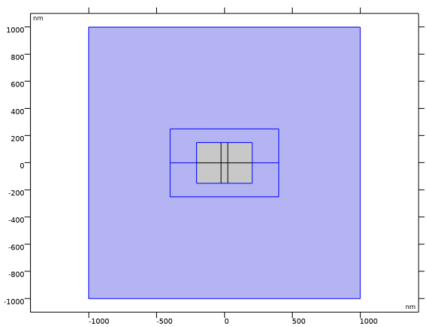
In the Model Builder window, under Component 1 (comp1) right-click Materials and choose Blank Material.
|
|
2
|
|
3
|
|
1
|
|
2
|
|
4
|
|
1
|
|
2
|
|
4
|
|
1
|
|
2
|
|
3
|
|
1
|
|
2
|
|
3
|
Click the Predefined button.
|
|
1
|
|
2
|
|
3
|
|
5
|
|
6
|
|
8
|
|
1
|
|
2
|
|
3
|
|
4
|
|
6
|
|
7
|
|
1
|
|
2
|
|
3
|
Click
|
|
6
|
Click
|
|
7
|
|
8
|
|
9
|
|
10
|
Click Replace.
|
|
11
|
|
13
|
|
1
|
|
2
|
|
1
|
|
2
|
|
3
|
|
1
|
|
2
|
|
3
|
|
4
|
|
5
|
|
6
|
|
1
|
|
1
|
|
2
|
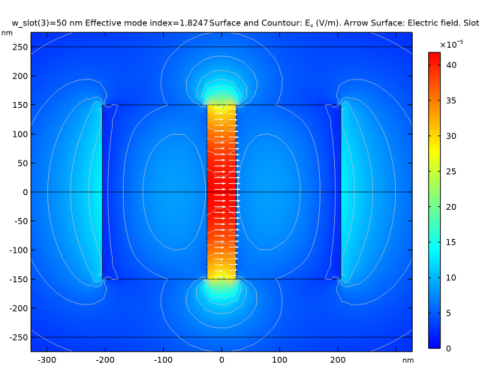
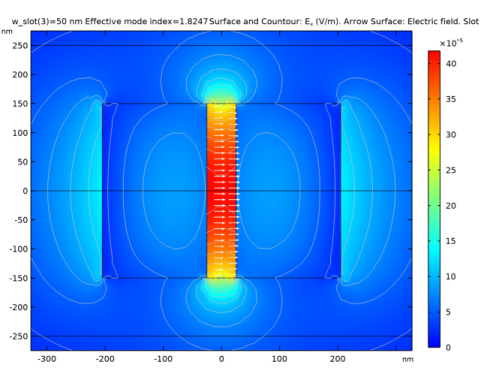
In the Settings window for Arrow Surface, click Replace Expression in the upper-right corner of the Expression section. From the menu, choose Component 1 (comp1)>Electromagnetic Waves, Frequency Domain>Electric>ewfd.Ex,ewfd.Ey - Electric field.
|
|
3
|
Locate the Arrow Positioning section. Find the X grid points subsection. In the Points text field, type 2.
|
|
4
|
|
5
|
|
6
|
|
7
|
|
1
|
|
2
|
|
3
|
|
4
|
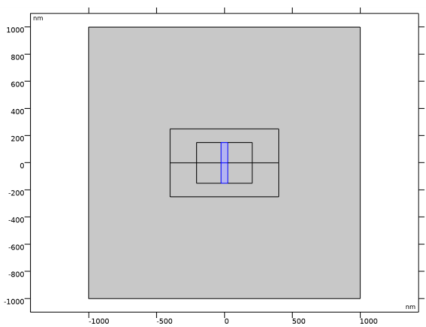
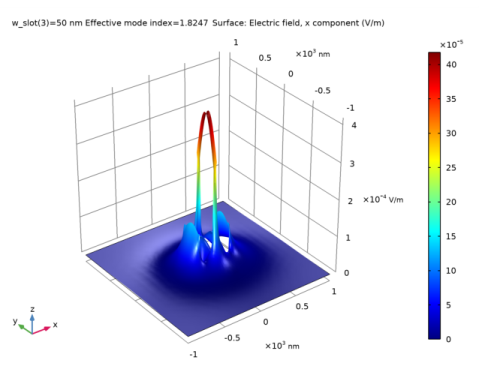
In the Title text area, type Surface and Countour: E<sub>x</sub> (V/m). Arrow Surface: Electric field. Slot width: 50 nm.
|
|
5
|
Click the
|
|
6
|
|
1
|
|
2
|
|
3
|
|
4
|
|
5
|
|
6
|
|
7
|
|
1
|
|
2
|
In the Settings window for 1D Plot Group, type Normalized Transverse Electric Field in the Label text field.
|
|
3
|
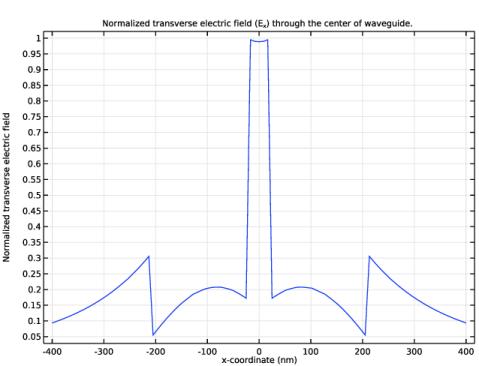
Locate the Data section. From the Dataset list, choose Cut Line 2D 1. Using the Cut Line dataset instead of a line selection will make the line appear as continuous also at points where the data actually is discontinuous.
|
|
4
|
|
5
|
|
6
|
|
7
|
|
8
|
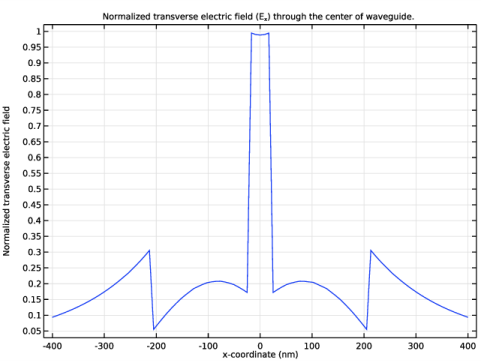
In the Title text area, type Normalized transverse electric field (E<sub>x</sub>) through the center of waveguide..
|
|
9
|
|
10
|
In the associated text field, type Normalized transverse electric field.
|
|
1
|
|
2
|
|
3
|
|
4
|
|
5
|
|
6
|
|
1
|
|
2
|
|
3
|
|
4
|
|
1
|
|
2
|
|
3
|
|
1
|
|
2
|
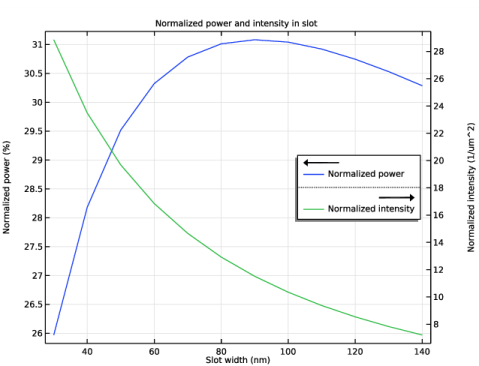
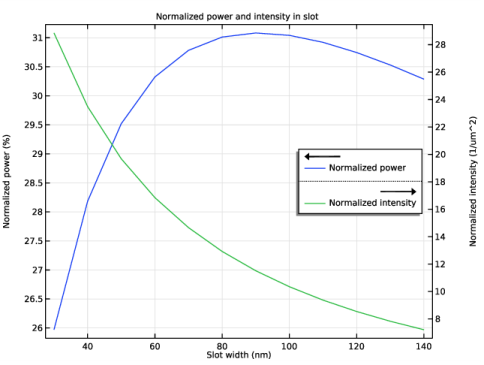
In the Settings window for 1D Plot Group, type Normalized Power and Intensity in the Label text field.
|
|
3
|
|
4
|
|
5
|
|
6
|
|
7
|
|
8
|
|
9
|
In the associated text field, type Slot width (nm).
|
|
10
|
|
11
|
In the associated text field, type Normalized power (%).
|
|
12
|
|
13
|
In the associated text field, type Normalized intensity (1/um^2).
|
|
1
|
|
2
|
|
4
|
|
5
|
|
6
|
|
7
|
|
1
|
|
2
|
|
4
|
Locate the Legends section. In the table, enter the following settings:
|
|
1
|
|
2
|
|
3
|
|
4
|
Locate the Legend section. From the Position list, choose Middle right, to make the legend panel not cover any of the line plots.
|
|
5
|