PDF

Fabry–Perot Resonator
Introduction
By properly arranging a set of mirrors, we can create passive optical resonators that are of great use to probe and manipulate light or to build lasers. The textbook example of a free space optical resonator is the combination of two spherical mirrors along the optical axis – a Fabry–Perot resonator. A peculiar property of such resonators is the fact that a light beam of defined shape and frequency can be transmitted with high transmission through the resonator even though it consists of two highly reflecting mirrors. In this model, we will study the transmission properties of a Fabry–Perot resonator and compare this to the analytic solution.
Figure 1: Geometry configuration of a Fabry–Perot resonator. The resonator consists of curved front and rear mirrors. Inside the cavity (located between the mirrors) and outside the cavity, there is air. The incident Gaussian beam propagates from left to right. Thus, to the left of the cavity there is both the incident and the reflected beam. Inside the cavity there is both a right- and left-propagating beam. To the right of the cavity, there is only the transmitted beam.
Two mirrors with radii ρ1 and ρ2, separated a distance L, can create a stable optical resonator, if they fulfill the stability criterion 0 < g1g2 < 1, where g1,2 = 1- L/ρ1,2 are the stability parameters of the two mirrors. A stable optical resonator defines a set of spatial modes, each one with a defined mode shape. If we want to excite a spatial mode of the resonator, we also have to consider that the distance of the two mirrors creates a resonance condition that needs to be fulfilled for a certain spatial mode. While it is possible to have high transmission on resonance, the resonator is highly reflective for off resonant frequencies.
We can define the free spectral range of the resonator ΔνFSR and the finesse F as
and
,
where c is the velocity of light and R1 and R2 are the respective mirror reflectance. The bandwidth of the resonance is then defined as
.
Please note that, depending on the cavity configuration, different spatial modes can exhibit different resonance frequencies. Any input field can be decomposed into the spatial modes of the resonator. Therefore, the resonator will act as a spatial as well as a frequency filter. We will focus here on efficiently exciting the fundamental mode of the resonator.
The fundamental mode of the resonator can be described by the waist,
,
where λ is the wavelength.
For the case of equal radii of curvature for the mirrors, ρ1 = ρ2, the waist is located at the center of the resonator.
Model Definition
To efficiently model the full wave solution of the 50 mm long Fabry–Perot resonator, the Electromagnetic Waves, Beam Envelopes interface in the bi-directional formulation is used. The first and second waves are two counter-propagating plane waves in vacuum. The geometry consists of the cavity separating the two mirrors and two exterior domains, one in front and one behind the cavity.
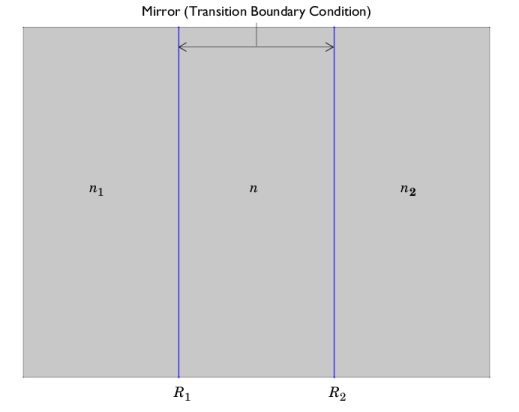
The mirrors are approximated as highly reflecting thin dielectric layers, modeled using the Transition Boundary Condition. To compute the reflectivity R of the thin dielectric layer (Transition Boundary Condition – TBC), we assume that the layer has a refractive index n and the surrounding layers have the refractive indices n1 and n2, respectively.
Figure 2: A mirror modeled as a thin dielectric layer with refractive index n, surrounded by materials with refractive index n1 and n2, respectively. The reflectances R1 and R2, for each interface, are indicated at the bottom of the picture. Each mirror is modeled using a Transition Boundary Condition feature.
The two material interfaces, depicted in Figure 2, have the amplitude reflectivities
and
,
respectively.
The corresponding power reflectances are then
.
The reflectance R of the film due to interference is
,
where is the accumulated phase when passing through the layer
.
Using a thickness d= λ/100 and refractive indices n = 15 and n1 = n2 = 1, both mirrors have a reflectance of 0.973. This corresponds to a finesse of F = 116.2.
A Gaussian beam is launched using the Scattering Boundary Condition. The input beam waist corresponds to the analytical solution of the cavity mode and the waist is located at the center of the cavity.
Results and Discussion
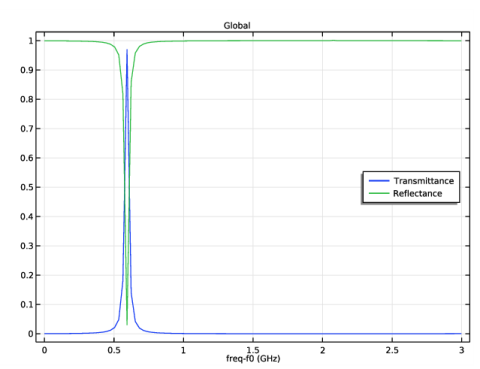
The sweep over one free spectral range shows only one resonance (Figure 3). This indicates that only one spatial mode is excited.
Figure 3: A frequency sweep over one free spectral range.
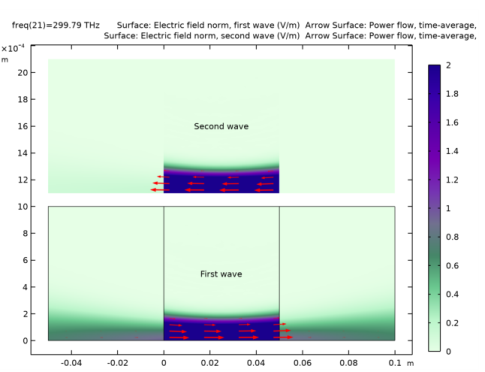
Figure 4 shows the norm of the electric field for the first and second waves at resonance. The first wave propagates from left to right and the second wave propagates from right to left. It is clear that at resonance, the field in the cavity is much larger than outside the cavity. Furthermore, there is almost no reflected wave at resonance and all power is transmitted.
Figure 4: The norm of the electric field for the first wave (bottom) and the second wave (top) at the resonance frequency. The arrows show the power flow for the two waves.
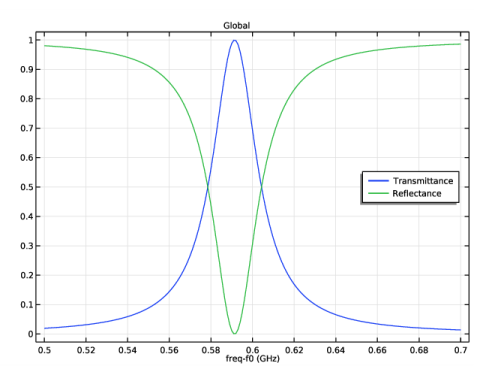
The second study (see Figure 5) carries out a finer sweep over the cavity resonance. On resonance, all light is transmitted through the cavity as is expected for good mode match.
Figure 5: A frequency sweep over the resonance peak.
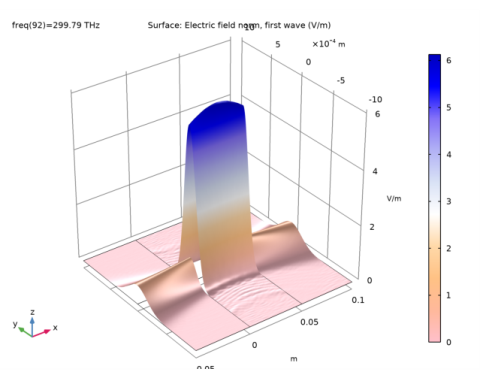
Figure 6 shows the electric field norm for the first wave at resonance. It confirms that the field inside the cavity is much higher than outside the cavity at resonance.
Figure 6: The norm of the electric field for the first wave at resonance.
Application Library path: Wave_Optics_Module/Verification_Examples/fabry_perot_resonator
Modeling Instructions
From the File menu, choose New.
New
In the New window, click  Model Wizard.
Model Wizard
1
In the Model Wizard window, click  2D.
2
In the Select Physics tree, select Optics>Wave Optics>Electromagnetic Waves, Beam Envelopes (ewbe).
3
Click Add.
4
Click  Study.
5
In the Select Study tree, select General Studies>Frequency Domain.
6
Global Definitions
Geometry Parameters
1
In the Model Builder window, under Global Definitions click Parameters 1.
2
In the Settings window for Parameters, type Geometry Parameters in the Label text field.
3
Locate the Parameters section. Click  Load from File.
4
Cavity Parameters
1
In the Home toolbar, click  Parameters and choose Add>Parameters.
2
In the Settings window for Parameters, type Cavity Parameters in the Label text field.
3
Locate the Parameters section. Click  Load from File.
4
Geometry 1
Circle 1 (c1)
1
In the Geometry toolbar, click  Circle.
2
In the Settings window for Circle, locate the Size and Shape section.
3
In the Radius text field, type rho1.
4
Locate the Position section. In the x text field, type rho1.
Circle 2 (c2)
1
In the Geometry toolbar, click  Circle.
2
In the Settings window for Circle, locate the Size and Shape section.
3
In the Radius text field, type rho2.
4
Locate the Position section. In the x text field, type l_cav-rho2.
5
Click  Build Selected.
6
Click the  Zoom Extents button in the Graphics toolbar.
Union 1 (uni1)
1
In the Geometry toolbar, click  Booleans and Partitions and choose Union.
2
Click in the Graphics window and then press Ctrl+A to select both objects.
Rectangle 1 (r1)
1
In the Geometry toolbar, click  Rectangle.
2
In the Settings window for Rectangle, locate the Size and Shape section.
3
In the Width text field, type l_total.
4
In the Height text field, type h_cav/2.
5
Locate the Position section. In the x text field, type -l_in.
Intersection 1 (int1)
1
In the Geometry toolbar, click  Booleans and Partitions and choose Intersection.
2
Click in the Graphics window and then press Ctrl+A to select both objects.
3
In the Settings window for Intersection, click  Build All Objects.
4
Click the  Zoom Extents button in the Graphics toolbar.
Definitions
In the Model Builder window, expand the Component 1 (comp1)>Definitions node.
Axis
1
In the Model Builder window, expand the Component 1 (comp1)>Definitions>View 1 node, then click Axis.
2
In the Settings window for Axis, locate the Axis section.
3
From the View scale list, choose Automatic.
4
Click  Update.
5
Click the  Zoom Extents button in the Graphics toolbar.
Materials
Air
1
In the Model Builder window, under Component 1 (comp1) right-click Materials and choose Blank Material.
2
In the Settings window for Material, type Air in the Label text field.
3
Locate the Material Contents section. In the table, enter the following settings:
Electromagnetic Waves, Beam Envelopes (ewbe)
1
In the Model Builder window, under Component 1 (comp1) click Electromagnetic Waves, Beam Envelopes (ewbe).
2
In the Settings window for Electromagnetic Waves, Beam Envelopes, locate the Components section.
3
From the Electric field components solved for list, choose Out-of-plane vector. This reduces the degrees of freedom for the model and restricts the solution to out-of-plane TE waves.
Perfect Magnetic Conductor 1
1
In the Physics toolbar, click  Boundaries and choose Perfect Magnetic Conductor condition to model even symmetry on the optical axis.
2
Transition Boundary Condition 1
Now, add a Transition Boundary Condition to model the mirrors. Assign a refractive index that is much larger than the refractive index of air, to create a high reflectivity for the mirrors.
1
In the Physics toolbar, click  Boundaries and choose Transition Boundary Condition.
2
3
In the Settings window for Transition Boundary Condition, locate the Transition Boundary Condition section.
4
From the n list, choose User defined. In the associated text field, type n.
5
From the k list, choose User defined. In the d text field, type d.
Scattering Boundary Condition 1
1
In the Physics toolbar, click  Boundaries and choose Scattering Boundary Condition.
Use a Scattering Boundary Condition to launch an incident Gaussian beam polarized in the z direction. This is compatible with the out-of plane setting for the interface.
2
3
In the Settings window for Scattering Boundary Condition, locate the Scattering Boundary Condition section.
4
From the Incident field list, choose Gaussian beam.
5
In the w0 text field, type w0.
6
In the p0 text field, type l_in+l_cav/2, which places the focal plane for the Gaussian beam at the center of the cavity.
7
Specify the Eg0 vector as
Reference Point 1
1
In the Physics toolbar, click  Attributes and choose Reference Point.
If no Reference Point subfeature is added to the Scattering Boundary Condition, the reference point will appear at the center point of the boundary. Add a Reference Point subfeature to make sure the reference point appears on the optical axis.
2
In the Settings window for Reference Point, locate the Point Selection section.
3
Click  Clear Selection.
4
Scattering Boundary Condition 2
1
In the Physics toolbar, click  Boundaries and choose Scattering Boundary Condition. This makes the boundary transparent for the transmitted field.
2
Definitions
Create integral operators for use in reflectance and transmittance calculation.
Integration 1 (intop1)
1
In the Definitions toolbar, click  Nonlocal Couplings and choose Integration.
2
In the Settings window for Integration, locate the Source Selection section.
3
From the Geometric entity level list, choose Boundary.
4
Integration 2 (intop2)
1
In the Definitions toolbar, click  Nonlocal Couplings and choose Integration.
2
In the Settings window for Integration, locate the Source Selection section.
3
From the Geometric entity level list, choose Boundary.
4
Variables 1
1
In the Model Builder window, right-click Definitions and choose Variables.
2
In the Settings window for Variables, locate the Variables section.
3
Mesh 1
The beam envelopes interface allows us to resolve only the resulting field envelope after demodulation with the prescribed phase function. Here, we adjust the number of elements perpendicular and along the optical axis to resolve this envelope properly.
1
In the Model Builder window, under Component 1 (comp1) click Mesh 1.
2
In the Settings window for Mesh, locate the Electromagnetic Waves, Beam Envelopes (ewbe) section.
3
In the NT text field, type 60. This will create the mapped mesh with sixty elements over the wavefront.
4
In the NL text field, type 30. This will create the mapped mesh with thirty elements along the simulation domain. This will be sufficient to study the Fabry-Perot cavity.
5
Click  Build All.
Study 1 - FSR Sweep
1
In the Model Builder window, click Study 1.
2
In the Settings window for Study, type Study 1 - FSR Sweep in the Label text field.
Step 1: Frequency Domain
1
In the Model Builder window, under Study 1 - FSR Sweep click Step 1: Frequency Domain.
2
In the Settings window for Frequency Domain, locate the Study Settings section.
3
In the Frequencies text field, type range(f0,FSR/101,f0+FSR).
4
In the Home toolbar, click  Compute.
Results
Electric Field (ewbe)
1
In the Settings window for 2D Plot Group, locate the Data section.
2
From the Parameter value (freq (THz)) list, choose 299.79 (21), which corresponds to the resonance frequency.
Electric Field
1
In the Model Builder window, expand the Electric Field (ewbe) node, then click Electric Field.
2
In the Settings window for Surface, locate the Expression section.
3
In the Expression text field, type ewbe.normE1 to display the norm of the electric field for the first wave.
4
Locate the Coloring and Style section. From the Color table list, choose AuroraBorealis.
5
Click to expand the Range section. Select the Manual color range check box.
6
In the Maximum text field, type 2.
Arrow Surface 1
1
In the Model Builder window, right-click Electric Field (ewbe) and choose Arrow Surface.
2
In the Settings window for Arrow Surface, click Replace Expression in the upper-right corner of the Expression section. From the menu, choose Component 1 (comp1)>Electromagnetic Waves, Beam Envelopes>Energy and power>ewbe.Poav1x,ewbe.Poav1y - Power flow, time-average, first wave.
3
Locate the Arrow Positioning section. Find the X grid points subsection. In the Points text field, type 10.
4
Find the Y grid points subsection. In the Points text field, type 21.
5
Locate the Coloring and Style section. From the Arrow length list, choose Logarithmic.
6
Select the Scale factor check box.
7
Electric Field 1
1
In the Model Builder window, right-click Electric Field and choose Duplicate.
2
In the Settings window for Surface, locate the Expression section.
3
In the Expression text field, type ewbe.normE2 to display the norm of the electric field for the second wave.
4
Click to expand the Inherit Style section. From the Plot list, choose Electric Field.
Deformation 1
1
Right-click Electric Field 1 and choose Deformation.
2
In the Settings window for Deformation, locate the Expression section.
3
In the Y component text field, type h_cav*0.55.
4
Locate the Scale section. Select the Scale factor check box.
5
Arrow Surface 2
1
In the Model Builder window, under Results>Electric Field (ewbe) right-click Arrow Surface 1 and choose Duplicate.
2
In the Settings window for Arrow Surface, locate the Expression section.
3
In the X component text field, type ewbe.Poav2x.
4
In the Y component text field, type ewbe.Poav2y.
5
Click to expand the Inherit Style section. From the Plot list, choose Arrow Surface 1.
Deformation 1
1
Right-click Arrow Surface 2 and choose Deformation.
2
In the Settings window for Deformation, locate the Expression section.
3
In the Y component text field, type h_cav*0.55.
4
Locate the Scale section. Select the Scale factor check box.
5
Annotation 1
1
In the Model Builder window, right-click Electric Field (ewbe) and choose Annotation.
2
In the Settings window for Annotation, locate the Annotation section.
3
In the Text text field, type First wave.
4
Locate the Position section. In the X text field, type l_cav/2.
5
In the Y text field, type h_cav/4.
6
Locate the Coloring and Style section. From the Anchor point list, choose Center.
7
Clear the Show point check box.
Annotation 2
1
Right-click Annotation 1 and choose Duplicate.
2
In the Settings window for Annotation, locate the Annotation section.
3
In the Text text field, type Second wave.
4
Locate the Position section. In the Y text field, type h_cav*0.55+h_cav/4.
5
In the Electric Field (ewbe) toolbar, click  Plot.
6
Click the  Zoom Extents button in the Graphics toolbar.
Sweep Over One FSR
1
In the Home toolbar, click  Add Plot Group and choose 1D Plot Group.
2
In the Settings window for 1D Plot Group, type Sweep Over One FSR in the Label text field.
Global 1
1
Right-click Sweep Over One FSR and choose Global.
2
In the Settings window for Global, locate the y-Axis Data section.
3
4
Locate the x-Axis Data section. From the Parameter list, choose Expression.
5
In the Expression text field, type freq-f0.
6
From the Unit list, choose GHz.
7
In the Sweep Over One FSR toolbar, click  Plot.
Sweep Over One FSR
1
In the Model Builder window, click Sweep Over One FSR.
2
In the Settings window for 1D Plot Group, locate the Legend section.
3
From the Position list, choose Middle right.
Now, create a study to only sweep over the resonance peak.
Add Study
1
In the Home toolbar, click  Add Study to open the Add Study window.
2
Go to the Add Study window.
3
Find the Studies subsection. In the Select Study tree, select General Studies>Frequency Domain.
4
Click Add Study in the window toolbar.
5
In the Home toolbar, click  Add Study to close the Add Study window.
Study 2 - Resonance Sweep
1
In the Model Builder window, click Study 2.
2
In the Settings window for Study, type Study 2 - Resonance Sweep in the Label text field.
Step 1: Frequency Domain
1
In the Model Builder window, under Study 2 - Resonance Sweep click Step 1: Frequency Domain.
2
In the Settings window for Frequency Domain, locate the Study Settings section.
3
In the Frequencies text field, type range(f0+0.5[GHz],0.001[GHz],f0+0.7[GHz]).
4
In the Home toolbar, click  Compute.
Results
Create a mirror dataset to be able to plot the full beam.
Mirror 2D 1
1
In the Results toolbar, click  More Datasets and choose Mirror 2D.
2
In the Settings window for Mirror 2D, locate the Data section.
3
From the Dataset list, choose Study 2 - Resonance Sweep/Solution 2 (sol2).
4
Locate the Axis Data section. In row Point 2, set X to 1.
5
In row Point 2, set Y to 0.
Electric Field (ewbe) 1
1
In the Model Builder window, click Electric Field (ewbe) 1.
2
In the Settings window for 2D Plot Group, locate the Data section.
3
From the Dataset list, choose Mirror 2D 1.
4
From the Parameter value (freq (THz)) list, choose 299.79 (92), which corresponds to the resonance frequency.
Electric Field
1
In the Model Builder window, expand the Electric Field (ewbe) 1 node, then click Electric Field.
2
In the Settings window for Surface, locate the Expression section.
3
In the Expression text field, type ewbe.normE1.
4
Locate the Coloring and Style section. From the Color table list, choose Twilight.
Height Expression 1
1
Right-click Electric Field and choose Height Expression.
2
In the Settings window for Height Expression, locate the Axis section.
3
Select the Scale factor check box.
4
5
In the Electric Field (ewbe) 1 toolbar, click  Plot.
6
In the Model Builder window, expand the Results>Views node.
Camera
1
In the Model Builder window, expand the Results>Views>View 3D 3 node, then click Camera.
2
In the Settings window for Camera, locate the Camera section.
3
From the View scale list, choose Automatic.
4
Click  Update.
5
Click the  Zoom Extents button in the Graphics toolbar.
Resonance Shape
1
In the Home toolbar, click  Add Plot Group and choose 1D Plot Group.
2
In the Settings window for 1D Plot Group, type Resonance Shape in the Label text field.
3
Locate the Data section. From the Dataset list, choose Study 2 - Resonance Sweep/Solution 2 (sol2).
4
Locate the Legend section. From the Position list, choose Middle right.
Global 1
1
Right-click Resonance Shape and choose Global.
2
In the Settings window for Global, locate the y-Axis Data section.
3
4
Locate the x-Axis Data section. From the Parameter list, choose Expression.
5
In the Expression text field, type freq-f0.
6
From the Unit list, choose GHz.