PDF

Aquifer Water Table Calculation
Introduction
This model demonstrates the application of COMSOL Multiphysics to a benchmark case of steady-state subsurface fluid flow and transient solute transport along a vertical cross section in an unconfined aquifer. Because of profound geologic heterogeneity, the model must estimate solute transport subject to highly irregular flow conditions with strong anisotropic dispersion. Van der Heijde (Ref. 1) classifies this case as “Level 2,” with enough potentially difficult parameter combinations to test a code’s ability to tackle realistic hydrological situations. Sudicky (Ref. 2) developed this problem to demonstrate a Laplace transform Galerkin code.
Model Definition
The hydrological setting for this problem is described in Figure 1, for groundwater flow at steady state. The aquifer is composed largely of fine-grained silty sand of hydraulic conductivity K1 = 5·10−4 cm/s with lenses of relatively course material of hydraulic conductivity K2 = 1·10−2 cm/s. Generally, groundwater moves from the upper surface of the saturated zone, the water table, to the outlet at x = 250 m. The water table is a free surface, that is, fluid pressure equals zero, across which there is vertical recharge, denoted by R, of 10 cm/a. The groundwater divide, a line of symmetry, occurs at x = 0. The base of the aquifer is impermeable.
Figure 2 shows conditions related to solute transport. The aquifer initially is pristine, and concentrations equal zero. For the first five years, a relative concentration of 1 is loaded over the interval 40 m < x < 80 m at the water table. The solute source is removed in year 5, and the concentration along this segment immediately drops to zero. The contaminant migrates within the aquifer via advection and dispersion. Throughout the domain, porosity, denoted by εp, is 0.35 as given by the benchmark, the longitudinal dispersivity, αL, and transverse vertical dispersivity, αT, are 0.5 m and 0.005 m, respectively. The effective molecular diffusion coefficient, Dm, is 1.34·10−5 cm2/s.
Figure 1: Settings for Darcy’s Law.
Figure 2: Definition of the transport problem.
Fluid Flow
Steady groundwater flow generally is expressed with a Darcy’s law for hydraulic head
(1)
where K (m/s) is the hydraulic conductivity, Qm (m3/s) is the rate of recharge to water table per unit volume of aquifer, and H is the hydraulic head (m). Darcy’s Law in COMSOL is formulated with pressure p as the dependent variable. Hydraulic head and pressure are related by
where D (m) is the elevation.
The equations for groundwater flow and solute transport are linked by the average linear velocity:
(2)
where the porosity εp or the fraction of the aquifer containing water accounts for the fact that only a portion of a given aquifer block is available for flow.
The boundary conditions for the groundwater flow problem are shown in Figure 1 and stated below. No flow condition and symmetry condition are applied at x = 0 and y = 0. Both are mathematically the same:
Hydraulic head is specified at x = 250 m. To model the recharge of 10 cm/a this velocity is specified at the upper boundary.
Solute Transport
Species transport typically is time dependent for geologic problems. The transport of a dissolved concentration c (mol/m3) is described with the advection-dispersion equation:
(3)
where DD(m2/s) is the dispersion tensor and De (m2/s) the effective diffusion; u is the velocity field; and t is time.
The dispersion tensor defines solute spreading by mechanical mixing and molecular diffusion. Typically, in porous media the spreading parallel to the flow (longitudinal dispersivity) exceeds the spreading perpendicular to the direction of flow (transverse dispersivity) by a multiple. This is an important aspect of the benchmark problem.
At the top boundary a space- and time-dependent function for the concentration is defined, according to
(4)
At the left boundary the concentration is set to zero and a no flux condition is applied to the right and bottom boundary.
Results and Discussion
Fluid Flow
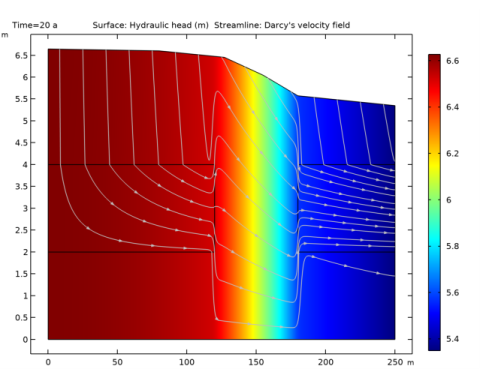
Figure 3 provides hydraulic heads estimated with the COMSOL Multiphysics steady-state groundwater flow simulation. The hydraulic heads and streamlines correspond nicely to the benchmark results provided by Sudicky (Ref. 2). The water table geometry determined for the simulation nearly duplicates the benchmark geometry. The good match between the flow fields is expected because the initial water table geometry used with COMSOL Multiphysics was designed to closely resemble the benchmark geometry.
Figure 3: Estimated hydraulic head and flow lines.
Solute Transport
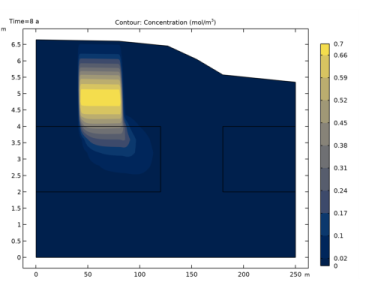
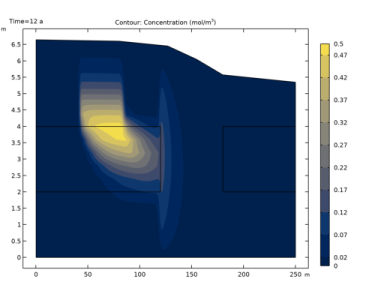
Solute transport solutions from the model are almost identical to the ones presented in Ref. 2. This is shown in the contour intervals for three times in Figure 4. In 1989, Sudicky concluded that the results illustrated in Ref. 2 are relatively free from numerical dispersion, as the low concentration contours closely follow the flow pattern. The surface plot for COMSOL also displays this property, in that even the lowest concentrations in Figure 4 still follow the irregular flow lines of Figure 3.
Figure 4: Solute concentration after 8, 12, and 20 years.
References
1. P.K.M. van der Heijde, “Model Testing: A Functionality Analysis, Performance Evaluation, and Applicability Assessment Protocol,” Groundwater Models for Resources Analysis and Management, A.I. El-Kadi (ed.), CRC Press, Lewis Publishers, Boca Raton, FL, pp. 39–58, 1995.
2. E.A.Sudicky, “The Laplace Transform Galerkin Technique: A Time-Continuous Finite Element Theory and Application to Mass Transport in Groundwater,” Water Resources Research, vol.25, No. 8, 1989.
Application Library path: Subsurface_Flow_Module/Solute_Transport/aquifer_water_table
Modeling Instructions
From the File menu, choose New.
New
In the New window, click  Model Wizard.
Model Wizard
1
In the Model Wizard window, click  2D.
2
In the Select Physics tree, select Fluid Flow>Porous Media and Subsurface Flow>Darcy’s Law (dl).
3
Click Add.
4
In the Select Physics tree, select Chemical Species Transport>Transport of Diluted Species in Porous Media (tds).
5
Click Add.
6
Click  Study.
7
In the Select Study tree, select General Studies>Stationary.
8
Geometry 1
Polygon 1 (pol1)
1
In the Geometry toolbar, click  Polygon.
2
In the Settings window for Polygon, locate the Coordinates section.
3
Rectangle 1 (r1)
1
In the Geometry toolbar, click  Rectangle.
2
In the Settings window for Rectangle, locate the Size and Shape section.
3
In the Width text field, type 120.
4
In the Height text field, type 2.
5
Locate the Position section. In the y text field, type 2.
Rectangle 2 (r2)
1
In the Geometry toolbar, click  Rectangle.
2
In the Settings window for Rectangle, locate the Size and Shape section.
3
In the Width text field, type 70.
4
In the Height text field, type 2.
5
Locate the Position section. In the x text field, type 180.
6
In the y text field, type 2.
7
Click  Build All Objects.
The geometry is elongated. Define another View which scales the view in the Graphics window for easier set-up.
Definitions
View 2
In the Model Builder window, under Component 1 (comp1) right-click Definitions and choose View.
Axis
1
In the Model Builder window, expand the View 2 node, then click Axis.
2
In the Settings window for Axis, locate the Axis section.
3
From the View scale list, choose Automatic.
4
Click  Update.
Darcy’s Law (dl)
Fluid and Matrix Properties 1
1
In the Model Builder window, under Component 1 (comp1)>Darcy’s Law (dl) click Fluid and Matrix Properties 1.
2
In the Settings window for Fluid and Matrix Properties, locate the Matrix Properties section.
3
From the Permeability model list, choose Hydraulic conductivity.
4
In the K text field, type 5e-4[cm/s].
The rectangles have a higher hydraulic conductivity.
Fluid and Matrix Properties 2
1
Right-click Component 1 (comp1)>Darcy’s Law (dl)>Fluid and Matrix Properties 1 and choose Duplicate.
2
3
In the Settings window for Fluid and Matrix Properties, locate the Matrix Properties section.
4
In the K text field, type 1e-2[cm/s].
Next, set up the boundary conditions.
Inlet 1
1
In the Physics toolbar, click  Boundaries and choose Inlet.
2
3
In the Settings window for Inlet, locate the Velocity section.
4
In the U0 text field, type 10[cm/a].
Hydraulic Head 1
1
In the Physics toolbar, click  Boundaries and choose Hydraulic Head.
2
3
In the Settings window for Hydraulic Head, locate the Hydraulic Head section.
4
In the H0 text field, type 5.3486.
Symmetry 1
1
In the Physics toolbar, click  Boundaries and choose Symmetry.
2
Next, set up the transport equations. One important aspect of this benchmark problem is anisotropic dispersivity with a ratio of 100 between longitudinal and transverse dispersivity.
Transport of Diluted Species in Porous Media (tds)
Fluid 1
1
In the Model Builder window, under Component 1 (comp1)>Transport of Diluted Species in Porous Media (tds)>Porous Medium 1 click Fluid 1.
2
In the Settings window for Fluid, locate the Convection section.
3
From the u list, choose Darcy’s velocity field (dl).
4
Locate the Diffusion section. In the DF,c text field, type 1.34e-5[cm^2/s].
Porous Medium 1
In the Model Builder window, click Porous Medium 1.
Dispersion 1
1
In the Physics toolbar, click  Attributes and choose Dispersion.
2
In the Settings window for Dispersion, locate the Dispersion section.
3
From the Dispersion tensor list, choose Dispersivity.
4
In the αL text field, type 0.5.
5
In the αT text field, type 0.005.
The next step is to set up the boundary conditions. At the top boundary the concentration is 0 except for the first five years within 40 m and 80 m. Define a function that will help you setting up this boundary condition.
Definitions
Rectangle 1 (rect1)
1
In the Home toolbar, click  Functions and choose Global>Rectangle.
2
In the Settings window for Rectangle, locate the Parameters section.
3
In the Lower limit text field, type 40.
4
In the Upper limit text field, type 80.
5
This defines the local position of the concentration source.
Transport of Diluted Species in Porous Media (tds)
Concentration 1
1
In the Physics toolbar, click  Boundaries and choose Concentration.
2
3
In the Settings window for Concentration, locate the Concentration section.
4
Select the Species c check box.
5
In the c0,c text field, type rect1(x[1/m])*(t<=5[a]).
This expression calls the rectangle function width the argument x and gives the location of the species source. It is followed by a logic expression that applies the concentration for the first five years only. After that it remains 0.
Concentration 2
1
In the Physics toolbar, click  Boundaries and choose Concentration.
2
3
In the Settings window for Concentration, locate the Concentration section.
4
Select the Species c check box.
Outflow 1
1
In the Physics toolbar, click  Boundaries and choose Outflow.
2
Add a material and fill out the missing values for the porosity and density.
Add Material
1
In the Home toolbar, click  Add Material to open the Add Material window.
2
Go to the Add Material window.
Material 1 (mat1)
1
In the Model Builder window, under Component 1 (comp1) right-click Materials and choose Blank Material.
2
In the Home toolbar, click  Add Material to close the Add Material window.
3
In the Settings window for Material, locate the Material Contents section.
4
Mesh 1
A proper mesh resolution ensures smooth and accurate results. Restrict the maximum element size to prevent too large mesh elements.
1
In the Model Builder window, under Component 1 (comp1) click Mesh 1.
2
In the Settings window for Mesh, locate the Physics-Controlled Mesh section.
3
From the Element size list, choose Extremely fine.
4
Locate the Mesh Settings section. From the Sequence type list, choose User-controlled mesh.
Size
1
In the Model Builder window, under Component 1 (comp1)>Mesh 1 click Size.
2
In the Settings window for Size, locate the Element Size section.
3
Click the Custom button.
4
Locate the Element Size Parameters section. In the Maximum element size text field, type 0.5.
5
Click  Build All.
Study 1
Now, set up the solver sequence. First calculate a stationary Darcy velocity field. Use this for the second time-dependent step which computes the transport of the species over 20 years.
Step 1: Stationary
1
In the Model Builder window, under Study 1 click Step 1: Stationary.
2
In the Settings window for Stationary, locate the Physics and Variables Selection section.
3
In the table, clear the Solve for check box for Transport of Diluted Species in Porous Media (tds).
Time Dependent
1
In the Study toolbar, click  Study Steps and choose Time Dependent>Time Dependent.
Now, solve for the concentration only. The Darcy velocity field used to calculate the convective transport is known from the previous stationary step.
2
In the Settings window for Time Dependent, locate the Physics and Variables Selection section.
3
In the table, clear the Solve for check box for Darcy’s Law (dl).
4
Locate the Study Settings section. From the Time unit list, choose a.
5
In the Output times text field, type range(0,1,20).
These are the output time steps. The solver will choose the computational time steps according to a convergence criteria. When using time dependent functions it is often recommended to restrict the computational time steps. Otherwise, if the convergence of the time-dependent solver is good, it can happen that the solver overestimates the required time step size and hence the user-defined time dependent function is not resolved properly.
Solution 1 (sol1)
1
In the Study toolbar, click  Show Default Solver.
2
In the Model Builder window, expand the Solution 1 (sol1) node, then click Time-Dependent Solver 1.
3
In the Settings window for Time-Dependent Solver, click to expand the Time Stepping section.
4
From the Steps taken by solver list, choose Strict.
5
In the Study toolbar, click  Compute.
Results
Pressure (dl)
A surface plot of the pressure field and a surface plot of the species concentration is created per default. Modify the surface plot to show the hydraulic head and add streamlines to create the plot shown in Figure 3.
Surface
1
In the Model Builder window, expand the Pressure (dl) node, then click Surface.
2
In the Settings window for Surface, locate the Expression section.
3
In the Expression text field, type dl.H.
Streamline 1
1
In the Model Builder window, click Streamline 1.
2
In the Settings window for Streamline, locate the Streamline Positioning section.
3
From the Positioning list, choose On selected boundaries.
4
Locate the Selection section. Select the  Activate Selection toggle button.
5
6
Locate the Streamline Positioning section. In the Number text field, type 15.
7
Locate the Coloring and Style section. Find the Point style subsection. From the Arrow length list, choose Normalized.
8
Select the Scale factor check box.
9
10
In the Pressure (dl) toolbar, click  Plot.
To create the concentration contour plots from Figure 4 proceed with the next steps.
Concentration Contours
1
In the Home toolbar, click  Add Plot Group and choose 2D Plot Group.
2
In the Settings window for 2D Plot Group, type Concentration Contours in the Label text field.
Contour 1
1
Right-click Concentration Contours and choose Contour.
2
In the Settings window for Contour, locate the Expression section.
3
In the Expression text field, type c.
4
Locate the Levels section. In the Total levels text field, type 10.
5
Locate the Coloring and Style section. From the Contour type list, choose Filled.
6
From the Color table list, choose Cividis.
7
Click the  Zoom Extents button in the Graphics toolbar.
To get the plots for the other times select them from the Time (a) list in the Data section of this plot group.