PDF

Vibration Analysis of a Deep Beam
Introduction
This example studies free and forced vibrations of a deep beam. With the increase of the ratio of section area per beam length, shear deformations and rotational inertia effects can no longer be neglected as it is done in the Euler-Bernoulli theory.
The solution for Eigenfrequency, frequency response and transient analysis are computed using a Timoshenko beam and compared with analytical results.
Model Definition
The model studied in this example consists of a simply supported beam with a square cross section. One end is pinned and has a constrained rotation along the beam axis. At the other end, the displacements in the plane of beam cross section are constrained.
For the forced vibration cases, a load in the y direction is applied all along the beam.
GEOMETRY
Beam length, 10 m
Material
Young’s modulus, E = 200 GPa
Mass density, ρ = 8000 kg/m3
Rayleigh damping coefficient: α = 5.36 s-1, β = 7.46e-5 m/s
Constraints
At x = 0, u = v = w =0; thx =0
At x = 10, v = w = 0
Load cases
The load with a magnitude F0 = 106N/m is applied and oriented in the local positive y direction. The following forced vibration cases are studied:
with f = 20 Hz.
Mesh
To satisfy the benchmark specifications, 5 edge elements are used to mesh the geometry.
Results and Discussion
Free vibration
In Table 1 the computed results are compared with the analytical results for the free vibration case. The agreement is good. The accuracy decreases with increasing complexity of the mode shape, because the possibility for the relatively coarse mesh to describe such a shape is limited.
Harmonic Forced Vibration
In Table 2 the computed results are compared with the analytical results for the harmonic forced vibration case. The agreement is good.
In Figure 1 the displacement at the middle of the beam is shown versus the frequency.
Figure 1: Displacement versus frequency, harmonic response.
In Figure 1 the bending stress at the middle of the beam is shown versus the frequency.
Figure 2: Bending stress versus frequency, harmonic response.
Periodic Forced Vibration
In Table 3 the computed results are compared with the analytical results. The agreement is good. The accuracy decreases with increasing complexity of the mode shape, because the possibility for the relatively coarse mesh to describe such a shape is limited.
In Figure 3 the displacement at the middle of the beam is shown versus the time.
Figure 3: Displacement versus time, periodic response.
In Figure 4 the bending stress at the middle of the beam is shown versus the time.
Figure 4: Bending stress versus time, periodic response.
Transient Forced Response
In Table 4 the computed results are compared with the analytical results. The agreement is good. The accuracy decreases with increasing complexity of the mode shape, because the possibility for the relatively coarse mesh to describe such a shape is limited.
In Figure 5 the displacement at the middle of the beam is shown versus the time.
Figure 5: Displacement versus time, transient response.
Reference
1. J. Maguire, D.J. Dawswell, L. Gould, “Selected Benchmarks for Forced Vibration,” NAFEMS R0016, 1989.
Application Library path: Structural_Mechanics_Module/Verification_Examples/vibrating_deep_beam
Modeling Instructions
From the File menu, choose New.
New
In the New window, click  Model Wizard.
Model Wizard
1
In the Model Wizard window, click  3D.
2
In the Select Physics tree, select Structural Mechanics>Beam (beam).
3
Click Add.
4
Click  Study.
5
In the Select Study tree, select General Studies>Eigenfrequency.
6
Global Definitions
Parameters 1
1
In the Model Builder window, under Global Definitions click Parameters 1.
2
In the Settings window for Parameters, locate the Parameters section.
3
Geometry 1
Polygon 1 (pol1)
1
In the Geometry toolbar, click  More Primitives and choose Polygon.
2
In the Settings window for Polygon, locate the Coordinates section.
3
Form Union (fin)
1
In the Model Builder window, click Form Union (fin).
2
In the Settings window for Form Union/Assembly, click  Build Selected.
Materials
Material 1 (mat1)
1
In the Model Builder window, under Component 1 (comp1) right-click Materials and choose Blank Material.
2
In the Settings window for Material, locate the Material Contents section.
3
Beam (beam)
1
In the Model Builder window, under Component 1 (comp1) click Beam (beam).
2
In the Settings window for Beam, locate the Beam Formulation section.
3
Cross-Section Data 1
1
In the Model Builder window, under Component 1 (comp1)>Beam (beam) click Cross-Section Data 1.
2
In the Settings window for Cross-Section Data, locate the Cross-Section Definition section.
3
From the list, choose Common sections.
4
In the hy text field, type 2.
5
In the hz text field, type 2.
Section Orientation 1
1
In the Model Builder window, expand the Cross-Section Data 1 node, then click Section Orientation 1.
2
In the Settings window for Section Orientation, locate the Section Orientation section.
3
From the Orientation method list, choose Orientation vector.
4
Specify the V vector as
Prescribed Displacement/Rotation 1
1
In the Physics toolbar, click  Points and choose Prescribed Displacement/Rotation.
2
3
In the Settings window for Prescribed Displacement/Rotation, locate the Prescribed Displacement section.
4
From the Displacement in x direction list, choose Prescribed.
5
From the Displacement in y direction list, choose Prescribed.
6
From the Displacement in z direction list, choose Prescribed.
7
Locate the Prescribed Rotation section. From the list, choose Rotation.
8
Select the Free rotation around y direction check box.
9
Select the Free rotation around z direction check box.
Prescribed Displacement/Rotation 2
1
In the Physics toolbar, click  Points and choose Prescribed Displacement/Rotation.
2
3
In the Settings window for Prescribed Displacement/Rotation, locate the Prescribed Displacement section.
4
From the Displacement in y direction list, choose Prescribed.
5
From the Displacement in z direction list, choose Prescribed.
Mesh 1
Edge 1
1
In the Mesh toolbar, click  Boundary and choose Edge.
2
In the Settings window for Edge, locate the Edge Selection section.
3
From the Geometric entity level list, choose Entire geometry.
Distribution 1
1
Right-click Edge 1 and choose Distribution.
2
Right-click Distribution 1 and choose Build All.
Free Vibration
1
In the Model Builder window, click Study 1.
2
In the Settings window for Study, type Free Vibration in the Label text field.
Step 1: Eigenfrequency
1
In the Model Builder window, under Free Vibration click Step 1: Eigenfrequency.
2
In the Settings window for Eigenfrequency, locate the Study Settings section.
3
Select the Desired number of eigenfrequencies check box.
4
5
In the Search for eigenfrequencies around text field, type 40.
To get all eigenfrequencies, including the duplicates at higher frequency, set a tighter tolerance in the solver sequence by following the steps below.
Solution 1 (sol1)
1
In the Study toolbar, click  Show Default Solver.
2
In the Model Builder window, expand the Solution 1 (sol1) node, then click Eigenvalue Solver 1.
3
In the Settings window for Eigenvalue Solver, locate the General section.
4
In the Relative tolerance text field, type 1.0E-10.
5
Click  Compute to Selected.
Change the Radius scale factor to 0.1 for better visualization.
Results
Line 1
1
In the Model Builder window, expand the Mode Shape (beam) node, then click Line 1.
2
In the Settings window for Line, locate the Coloring and Style section.
3
In the Radius scale factor text field, type 0.1.
Beam (beam)
Edge Load 1
1
In the Physics toolbar, click  Edges and choose Edge Load.
2
In the Settings window for Edge Load, locate the Edge Selection section.
3
From the Selection list, choose All edges.
4
Locate the Force section. Specify the FL vector as
5
Right-click Edge Load 1 and choose Harmonic Perturbation.
Linear Elastic Material 1
In the Model Builder window, click Linear Elastic Material 1.
Damping 1
1
In the Physics toolbar, click  Attributes and choose Damping.
2
In the Settings window for Damping, locate the Damping Settings section.
3
In the αdM text field, type 5.36.
4
In the βdK text field, type 7.46e-5.
Add Study
1
In the Home toolbar, click  Add Study to open the Add Study window.
2
Go to the Add Study window.
3
Find the Studies subsection. In the Select Study tree, select Preset Studies for Selected Physics Interfaces>Frequency Domain, Modal.
4
Click Add Study in the window toolbar.
5
In the Home toolbar, click  Add Study to close the Add Study window.
Harmonic Forced Vibration
1
In the Model Builder window, click Study 2.
2
In the Settings window for Study, type Harmonic Forced Vibration in the Label text field.
3
Locate the Study Settings section. Clear the Generate default plots check box.
Step 2: Frequency Domain, Modal
1
In the Model Builder window, under Harmonic Forced Vibration click Step 2: Frequency Domain, Modal.
2
In the Settings window for Frequency Domain, Modal, locate the Study Settings section.
3
In the Frequencies text field, type range(0,2,38) range(40,5e-2,45) range(46,2,60).
4
In the Home toolbar, click  Compute.
Results
Cut Point 3D 1
1
In the Results toolbar, click  Cut Point 3D.
2
In the Settings window for Cut Point 3D, locate the Data section.
3
From the Dataset list, choose Harmonic Forced Vibration/Solution 2 (sol2).
4
Locate the Point Data section. In the X text field, type L/2.
5
In the Y text field, type 0.
6
In the Z text field, type 0.
Harmonic Peak Displacement
1
In the Results toolbar, click  1D Plot Group.
2
In the Settings window for 1D Plot Group, type Harmonic Peak Displacement in the Label text field.
3
Locate the Data section. From the Dataset list, choose Cut Point 3D 1.
Point Graph 1
1
Right-click Harmonic Peak Displacement and choose Point Graph.
2
In the Settings window for Point Graph, locate the y-Axis Data section.
3
In the Expression text field, type beam.uAmpZ.
4
From the Unit list, choose mm.
5
In the Harmonic Peak Displacement toolbar, click  Plot.
Harmonic Peak Stress
1
In the Model Builder window, right-click Harmonic Peak Displacement and choose Duplicate.
2
In the Settings window for 1D Plot Group, type Harmonic Peak Stress in the Label text field.
Point Graph 1
1
In the Model Builder window, expand the Harmonic Peak Stress node, then click Point Graph 1.
2
In the Settings window for Point Graph, locate the y-Axis Data section.
3
In the Expression text field, type abs(beam.sb1).
4
From the Unit list, choose MPa.
5
In the Harmonic Peak Stress toolbar, click  Plot.
Harmonic Peak Displacement
1
In the Results toolbar, click  More Derived Values and choose Maximum>Line Maximum.
2
In the Settings window for Line Maximum, type Harmonic Peak Displacement in the Label text field.
3
Locate the Data section. From the Dataset list, choose Harmonic Forced Vibration/Solution 2 (sol2).
4
From the Parameter selection (freq) list, choose From list.
5
In the Parameter values (freq (Hz)) list, select 42.65.
6
7
Locate the Expressions section. In the table, enter the following settings:
8
Click  Evaluate.
Harmonic Peak Stress
1
Right-click Harmonic Peak Displacement and choose Duplicate.
2
In the Settings window for Line Maximum, type Harmonic Peak Stress in the Label text field.
3
Locate the Expressions section. In the table, enter the following settings:
4
Clicknext to  Evaluate, then choose New Table.
Definitions
Interpolation 1 (int1)
1
In the Home toolbar, click  Functions and choose Global>Interpolation.
2
In the Settings window for Interpolation, locate the Definition section.
3
In the Function name text field, type phase.
4
5
Locate the Interpolation and Extrapolation section. From the Interpolation list, choose Nearest neighbor.
6
Locate the Units section. In the Arguments text field, type Hz.
7
In the Function text field, type rad.
Beam (beam)
Edge Load 2
1
In the Physics toolbar, click  Edges and choose Edge Load.
2
3
In the Settings window for Edge Load, locate the Force section.
4
Specify the FL vector as
Phase 1
1
In the Physics toolbar, click  Attributes and choose Phase.
2
In the Settings window for Phase, locate the Load Phase section.
3
Specify the φ vector as
Add Study
1
In the Home toolbar, click  Add Study to open the Add Study window.
2
Go to the Add Study window.
3
Find the Studies subsection. In the Select Study tree, select General Studies>Frequency Domain.
4
Click  Add Study.
5
In the Home toolbar, click  Add Study to close the Add Study window.
Study 3
Step 1: Frequency Domain
1
In the Settings window for Frequency Domain, locate the Study Settings section.
2
In the Frequencies text field, type 20 60.
3
Locate the Physics and Variables Selection section. Select the Modify model configuration for study step check box.
4
In the Physics and variables selection tree, select Component 1 (comp1)>Beam (beam)>Edge Load 1.
5
Click  Disable.
Frequency to Time FFT
1
In the Study toolbar, click  Study Steps and choose Time Dependent>Frequency to Time FFT.
2
In the Settings window for Frequency to Time FFT, locate the Study Settings section.
3
In the Times text field, type range(0.0,1/(200*20),1/20).
4
From the Scaling list, choose Discrete Fourier transform.
5
Locate the Physics and Variables Selection section. Select the Modify model configuration for study step check box.
6
In the Physics and variables selection tree, select Component 1 (comp1)>Beam (beam)>Edge Load 1.
Solution 4 (sol4)
1
In the Study toolbar, click  Show Default Solver.
2
In the Model Builder window, expand the Solution 4 (sol4) node, then click FFT Solver 1.
3
In the Settings window for FFT Solver, locate the General section.
4
From the Defined by study step list, choose User defined.
5
In the Model Builder window, click Study 3.
6
In the Settings window for Study, type Periodic Forced Vibration in the Label text field.
7
Locate the Study Settings section. Clear the Generate default plots check box.
8
In the Study toolbar, click  Compute.
Results
Cut Point 3D 2
1
In the Results toolbar, click  Cut Point 3D.
2
In the Settings window for Cut Point 3D, locate the Data section.
3
From the Dataset list, choose Periodic Forced Vibration/Solution 4 (sol4).
4
Locate the Point Data section. In the X text field, type L/2.
5
In the Y text field, type 0.
6
In the Z text field, type 0.
Periodic Peak Displacement
1
In the Results toolbar, click  1D Plot Group.
2
In the Settings window for 1D Plot Group, type Periodic Peak Displacement in the Label text field.
3
Locate the Data section. From the Dataset list, choose Cut Point 3D 2.
Point Graph 1
1
Right-click Periodic Peak Displacement and choose Point Graph.
2
In the Settings window for Point Graph, locate the y-Axis Data section.
3
In the Expression text field, type w.
4
From the Unit list, choose mm.
5
In the Periodic Peak Displacement toolbar, click  Plot.
Periodic Peak Stress
1
In the Model Builder window, right-click Periodic Peak Displacement and choose Duplicate.
2
In the Settings window for 1D Plot Group, type Periodic Peak Stress in the Label text field.
Point Graph 1
1
In the Model Builder window, expand the Periodic Peak Stress node, then click Point Graph 1.
2
In the Settings window for Point Graph, locate the y-Axis Data section.
3
In the Expression text field, type beam.sb1.
4
From the Unit list, choose MPa.
5
In the Periodic Peak Stress toolbar, click  Plot.
Periodic Peak Displacement
1
In the Results toolbar, click  More Derived Values and choose Maximum>Line Maximum.
2
In the Settings window for Line Maximum, type Periodic Peak Displacement in the Label text field.
3
Locate the Data section. From the Dataset list, choose Periodic Forced Vibration/Solution 4 (sol4).
4
5
Locate the Expressions section. In the table, enter the following settings:
6
Locate the Data Series Operation section. From the Operation list, choose Maximum.
7
Click  Evaluate.
Periodic Peak Stress
1
Right-click Periodic Peak Displacement and choose Duplicate.
2
In the Settings window for Line Maximum, type Periodic Peak Stress in the Label text field.
3
Locate the Expressions section. In the table, enter the following settings:
4
Clicknext to  Evaluate, then choose New Table.
Beam (beam)
Edge Load 3
1
In the Physics toolbar, click  Edges and choose Edge Load.
2
In the Settings window for Edge Load, locate the Edge Selection section.
3
From the Selection list, choose All edges.
4
Locate the Force section. Specify the FL vector as
Add Study
1
In the Home toolbar, click  Add Study to open the Add Study window.
2
Go to the Add Study window.
3
Find the Studies subsection. In the Select Study tree, select General Studies>Time Dependent.
4
Click Add Study in the window toolbar.
5
In the Home toolbar, click  Add Study to close the Add Study window.
Study 4
Step 1: Time Dependent
1
In the Settings window for Time Dependent, locate the Study Settings section.
2
In the Output times text field, type range(0,1e-4,1.2e-2) range(1.3e-2,1e-3,1.2).
3
From the Tolerance list, choose User controlled.
4
In the Relative tolerance text field, type 1e-3.
5
Locate the Physics and Variables Selection section. Select the Modify model configuration for study step check box.
6
In the Physics and variables selection tree, select Component 1 (comp1)>Beam (beam)>Edge Load 1.
7
Click  Disable.
8
In the Physics and variables selection tree, select Component 1 (comp1)>Beam (beam)>Edge Load 2.
9
Click  Disable.
10
In the Model Builder window, click Study 4.
11
In the Settings window for Study, type Transient Forced Vibration in the Label text field.
12
Locate the Study Settings section. Clear the Generate default plots check box.
Solution 6 (sol6)
1
In the Study toolbar, click  Show Default Solver.
2
In the Model Builder window, expand the Solution 6 (sol6) node.
3
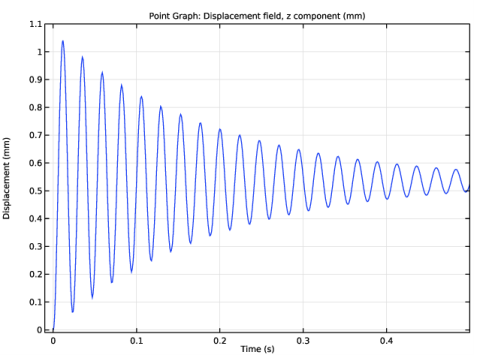
In the Model Builder window, expand the Transient Forced Vibration>Solver Configurations>Solution 6 (sol6)>Dependent Variables 1 node, then click Displacement field (comp1.u).
4
In the Settings window for Field, locate the Scaling section.
5
In the Scale text field, type 1e-4.
6
In the Model Builder window, click Time-Dependent Solver 1.
7
In the Settings window for Time-Dependent Solver, click to expand the Time Stepping section.
8
From the Steps taken by solver list, choose Intermediate.
9
Click  Compute.
Results
Cut Point 3D 3
1
In the Results toolbar, click  Cut Point 3D.
2
In the Settings window for Cut Point 3D, locate the Data section.
3
From the Dataset list, choose Transient Forced Vibration/Solution 6 (sol6).
4
Locate the Point Data section. In the X text field, type L/2.
5
In the Y text field, type 0.
6
In the Z text field, type 0.
Transient Peak Displacement
1
In the Results toolbar, click  1D Plot Group.
2
In the Settings window for 1D Plot Group, type Transient Peak Displacement in the Label text field.
3
Locate the Data section. From the Dataset list, choose Cut Point 3D 3.
4
Locate the Plot Settings section. Select the x-axis label check box.
5
6
Select the y-axis label check box.
7
8
Locate the Axis section. Select the Manual axis limits check box.
9
In the x minimum text field, type -1e-2.
10
In the x maximum text field, type 0.5.
11
In the y minimum text field, type -1e-2.
12
In the y maximum text field, type 1.1.
Point Graph 1
1
Right-click Transient Peak Displacement and choose Point Graph.
2
In the Settings window for Point Graph, locate the y-Axis Data section.
3
In the Expression text field, type w.
4
From the Unit list, choose mm.
5
In the Transient Peak Displacement toolbar, click  Plot.
6
Transient Forced Vibration - Max Displacement
1
In the Results toolbar, click  More Derived Values and choose Maximum>Line Maximum.
2
In the Settings window for Line Maximum, type Transient Forced Vibration - Max Displacement in the Label text field.
3
Locate the Data section. From the Dataset list, choose Transient Forced Vibration/Solution 6 (sol6).
4
From the Time selection list, choose From list.
5
In the Times (s) list, select 0.0117.
6
7
Locate the Expressions section. In the table, enter the following settings:
8
Locate the Data Series Operation section. From the Operation list, choose Maximum.
9
Click  Evaluate.
Transient Forced Vibration - Max Stress
1
Right-click Transient Forced Vibration - Max Displacement and choose Duplicate.
2
In the Settings window for Line Maximum, type Transient Forced Vibration - Max Stress in the Label text field.
3
Locate the Expressions section. In the table, enter the following settings:
4
Clicknext to  Evaluate, then choose New Table.
Transient Forced Vibration - Static Displacement
1
In the Model Builder window, right-click Transient Forced Vibration - Max Displacement and choose Duplicate.
2
In the Settings window for Line Maximum, type Transient Forced Vibration - Static Displacement in the Label text field.
3
Locate the Data section. From the Time selection list, choose Interpolated.
4
In the Times (s) text field, type range(1.1,1e-3,1.2).
5
Locate the Expressions section. In the table, enter the following settings:
6
Locate the Data Series Operation section. From the Operation list, choose Average.
7
Clicknext to  Evaluate, then choose New Table.
Table
1
Go to the Table window.
The vibration analysis is now finished. If you want to save the model and run the study with the configuration set in the previous steps, you need to disable some of the nodes added after you run that particular study. If you do not want to save the model you do not need to follow the steps below.
Free Vibration
Step 1: Eigenfrequency
1
In the Model Builder window, under Free Vibration click Step 1: Eigenfrequency.
2
In the Settings window for Eigenfrequency, locate the Physics and Variables Selection section.
3
Select the Modify model configuration for study step check box.
4
In the Physics and variables selection tree, select Component 1 (comp1)>Beam (beam)>Linear Elastic Material 1>Damping 1.
5
Click  Disable.
Harmonic Forced Vibration
Step 2: Frequency Domain, Modal
1
In the Model Builder window, under Harmonic Forced Vibration click Step 2: Frequency Domain, Modal.
2
In the Settings window for Frequency Domain, Modal, locate the Physics and Variables Selection section.
3
Select the Modify model configuration for study step check box.
4
In the Physics and variables selection tree, select Component 1 (comp1)>Beam (beam)>Edge Load 2.
5
Click  Disable.
6
In the Physics and variables selection tree, select Component 1 (comp1)>Beam (beam)>Edge Load 3.
7
Click  Disable.
Periodic Forced Vibration
Step 1: Frequency Domain
1
In the Model Builder window, under Periodic Forced Vibration click Step 1: Frequency Domain.
2
In the Settings window for Frequency Domain, locate the Physics and Variables Selection section.
3
In the Physics and variables selection tree, select Component 1 (comp1)>Beam (beam)>Edge Load 3.
4
Click  Disable.
Step 2: Frequency to Time FFT
1
In the Model Builder window, click Step 2: Frequency to Time FFT.
2
In the Settings window for Frequency to Time FFT, locate the Physics and Variables Selection section.
3
In the Physics and variables selection tree, select Component 1 (comp1)>Beam (beam)>Edge Load 3.
4
Click  Disable.