PDF

Fundamental Eigenfrequency of a Rotating Blade
Introduction
High rotational speed in, for example, gas turbine machinery can result in centrifugal forces of considerable magnitude. This example studies the effects of such forces on the natural frequencies of the structure.
The fictitious forces induced by the rotation give rise to two counteracting effects: stress-stiffening and spin-softening (or centrifugal softening). The former is caused by the stationary stress field created by the centrifugal force and acts to increase the stiffness of the body, and so increase its resonance frequencies. At the same time, any radial displacement away from the axis of rotation increases the centrifugal force, while motion toward the axis decreases it. This effect therefore tends to amplify any radial motion, which is the opposite of stiffening — hence spin-softening. Which mechanism is dominating depends on the shape of the particular mode.
In some rotating systems, Coriolis forces can also play an important role. These apparent forces split some natural modes of vibration into one co-rotating and one counterrotating precessing mode. In particular, this happens for natural modes that include bending of the axis of rotation. For most modes of vibration, however, the Coriolis frequency shifts are small.
Model Definition
In the first part of the modeling, you conduct a modal analysis of a blade mounted on a rigid rotating cylinder. The rotational speed is 3000 rpm (100π rad/s) about the global y-axis. The goal is to compare the fundamental frequency in three cases:
A basic modal analysis at 0 rpm, thus excluding any fictitious force effects.
The result in the first two cases can be compared directly to an analytical reference solution. Once you are satisfied that the solutions are accurate in all cases, the second step proceeds to compute the first few natural frequencies for a large range of rotational speeds.
Fictitious Forces in Rotating Coordinate Systems
The spin-softening and Coriolis effects both ultimately arise because the standard form of the laws governing the deformation of solid objects only hold in inertial, that is, nonaccelerating, coordinate systems. When you build and simulate a model in a rotating coordinate system, you must extend the basic laws of motion to account for the acceleration of the system itself.
In COMSOL Multiphysics, you can model the frame acceleration effects by using the Rotating Frame domain feature.
In this particular case, the axis of rotation is the y-axis, see Figure 1. The only explicit boundary condition in the model is on the blade’s base, which is fixed to the axis.
Stress-Stiffening and Nonlinear Effects
To include the stress-stiffening effects in the model, you activate the large deformation option. This redefines the strain measure to include second-order terms, which makes the strain-displacement relation nonlinear. The resulting strain measure is called Green strain.
For the stress stiffening to have any effect on the natural frequencies, you must first solve for the stationary stresses from the centrifugal loading in a stationary analysis. Then you perform the modal analysis using the static solution as a linearization point.
Note that the spin-softening affects not only the modal solution but also adds a positive feedback to the stationary nonlinear solution. If the structure has a natural mode for which spin-softening dominates over the stress-stiffening effect, the natural frequency of this mode becomes zero for some rotational frequency. This means that the structure looses all stiffness, and that no stable solution exists for higher angular velocities. So if the nonlinear solver does not converge for a very fast rotation, it should come as no surprise.
Material and Geometrical Properties
The blade’s material and geometrical properties are given in the table below (see also Figure 1):
ν
ρ
The approximate equation for the natural frequency in Ref. 1 does not include the Poisson’s ratio. To facilitate easy comparison, the Poisson’s ratio is set to zero in the modeling.
Figure 1: Blade geometry.
Analytical Solutions
You can compare COMSOL Multiphysics’ results to an accurate analytical approximation. Using Euler beam theory, which is sufficiently accurate for the present geometry, the fundamental angular frequency for the nonrotating case is given by
where E is the Young’s modulus, I is the area moment of inertia, m is the mass per unit length, and L is the blade length.
For a rotating blade attached to a rigid axis with radius r and rotating with angular frequency Ω, the fundamental angular frequency according to Ref. 1 is
This formula assumes a blade of uniform cross section slanted at the so-called stagger angle . In the present case, . The author states without proof that the Coriolis effect is negligible. You can check the validity of this statement by comparing the finite element solutions with and without the Coriolis term included.
Results and Discussion
The following table shows a comparison between the analytical results and the results computed in COMSOL Multiphysics:
Apparently, the Coriolis effect is negligible as stated in Ref. 1. Because including the Coriolis terms makes the system of equations nonsymmetric — and therefore more expensive to solve — there is, in general, no need to include the Coriolis effect when modeling systems with a rigid axis.
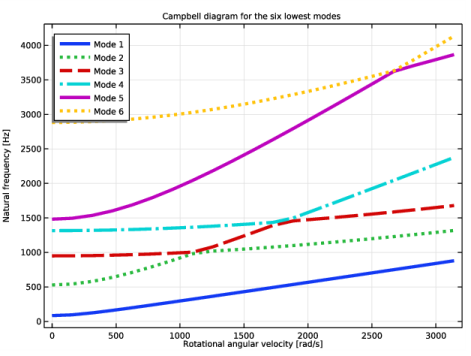
Figure 2: Campbell diagram created from the parametric sweep output file. Notice the crossing modes, which are misinterpreted because of the sorting of the natural frequencies.
The Campbell diagram, see Figure 2, shows that the first 6 natural frequencies all increase with increasing rotational speed. However, the balance between stress stiffening and spin softening is different for the different modes. Stress stiffening is more pronounced for modes 2 and 5 (referring to the mode order at zero rotational frequency) compared to the others. Therefore, the order of the modes in the result file — which is sorted on mode frequency — changes with increasing rotational velocity.
Notes About the COMSOL Implementation
Note that the eigenvalue solver always finds the requested number of modes but not necessarily the ones with lowest eigenfrequencies. Sometimes it can converge on a higher-order mode instead. A jagged appearance of the highest frequency mode in the Campbell diagram is a result of the solver’s picking a higher mode instead of requested highest mode for some rotational frequencies. In order to avoid this behavior it is recommended to solve for one additional eigenfrequency in the study and display results for all eigenfrequencies except the one of the highest mode.
When eigenfrequencies are calculated, numerical noise can occasionally be seen via the imaginary part of the eigenfrequency. If the imaginary part is several orders of magnitude smaller than the real part then use the real part as the eigenfrequency and disregard the imaginary part.
Reference
1. W. Carnegie, “Vibrations of Rotating Cantilever Blading”, J. Mech. Engrg Sci., vol. 1, no. 3, London, 1959.
Application Library path: Structural_Mechanics_Module/Dynamics_and_Vibration/rotating_blade
Modeling Instructions
From the File menu, choose New.
New
In the New window, click  Model Wizard.
Model Wizard
1
In the Model Wizard window, click  3D.
2
In the Select Physics tree, select Structural Mechanics>Solid Mechanics (solid).
3
Click Add.
4
Click  Study.
5
In the Select Study tree, select Preset Studies for Selected Physics Interfaces>Eigenfrequency, Prestressed.
6
Global Definitions
Parameters 1
1
In the Model Builder window, under Global Definitions click Parameters 1.
2
In the Settings window for Parameters, locate the Parameters section.
3
Geometry 1
Block 1 (blk1)
1
In the Geometry toolbar, click  Block.
2
In the Settings window for Block, locate the Size and Shape section.
3
In the Width text field, type L.
4
In the Depth text field, type b.
5
In the Height text field, type d.
6
Locate the Position section. In the x text field, type r.
7
In the z text field, type -d/2.
8
Click  Build Selected.
Form Union (fin)
1
In the Model Builder window, click Form Union (fin).
2
In the Settings window for Form Union/Assembly, click  Build Selected.
Materials
Material 1 (mat1)
1
In the Model Builder window, under Component 1 (comp1) right-click Materials and choose Blank Material.
2
3
In the Settings window for Material, locate the Material Contents section.
4
Solid Mechanics (solid)
Rotating Frame 1
1
In the Model Builder window, under Component 1 (comp1) right-click Solid Mechanics (solid) and choose Volume Forces>Rotating Frame.
2
3
In the Settings window for Rotating Frame, locate the Rotating Frame section.
4
From the Axis of rotation list, choose y-axis.
5
In the Ω text field, type Omega.
Fixed Constraint 1
1
In the Physics toolbar, click  Boundaries and choose Fixed Constraint.
2
Mesh 1
Mapped 1
1
In the Mesh toolbar, click  Boundary and choose Mapped.
2
Distribution 1
1
Right-click Mapped 1 and choose Distribution.
2
Distribution 2
1
In the Model Builder window, right-click Mapped 1 and choose Distribution.
2
3
In the Settings window for Distribution, locate the Distribution section.
4
In the Number of elements text field, type 25.
Mapped 1
Right-click Mapped 1 and choose Build Selected.
Swept 1
In the Mesh toolbar, click  Swept.
Distribution 1
1
Right-click Swept 1 and choose Distribution.
2
3
In the Settings window for Distribution, locate the Distribution section.
4
In the Number of elements text field, type 4.
5
In the Model Builder window, right-click Mesh 1 and choose Build All.
Study 1
The default solver settings consist of a sequence of a stationary study step followed by an eigenfrequency analysis. COMSOL Multiphysics stores the solution from the stationary solver and uses it as the linearization point for the eigenfrequency analysis. Together with the fact that a geometrically nonlinear analysis is preselected, this ensures that effects of stress-stiffening and spin-softening are included in the calculated eigenfrequencies.
1
In the Home toolbar, click  Compute.
Results
Surface 1
The default plot shows the scaled deformation for the first mode of vibration for the nonrotating blade.
The first mode occurs at 84.4 Hz. This agrees well with the analytical solution, which you can compute as described below.
Global Evaluation 1
1
In the Model Builder window, expand the Results>Mode Shape (solid) node.
2
Right-click Derived Values and choose Global Evaluation.
3
In the Settings window for Global Evaluation, locate the Data section.
4
From the Eigenfrequency selection list, choose First.
5
Click Replace Expression in the upper-right corner of the Expressions section. From the menu, choose Global definitions>Parameters>f_ref - Reference resonance frequency - rad/s.
6
Click  Evaluate.
The table in the Table window shows that the analytical value of the first mode is also 84.4 Hz.
Next, solve for the eigenfrequencies of the blade rotating at 3000 RPM.
Global Definitions
Parameters 1
1
In the Model Builder window, under Global Definitions click Parameters 1.
2
In the Settings window for Parameters, locate the Parameters section.
3
Study 1
In the Home toolbar, click  Compute.
Results
Mode Shape (solid)
The default plot now shows the scaled deformation for the first mode of vibration when the blade is rotating at 3000 RPM. In this case the first eigenmode occurs at 124 Hz. This result clearly shows the effect of stress-stiffening.
Global Evaluation 1
1
In the Model Builder window, click Global Evaluation 1.
2
In the Settings window for Global Evaluation, click  Evaluate.
The table in the Table window shows that the analytical value of the first mode is 123.6 Hz.
In the next section, you will also include the Coriolis effect and solve for the eigenfrequencies of the blade rotating at 3000 RPM.
Solid Mechanics (solid)
Rotating Frame 1
1
In the Model Builder window, under Component 1 (comp1)>Solid Mechanics (solid) click Rotating Frame 1.
2
In the Settings window for Rotating Frame, locate the Frame Acceleration Effect section.
3
Select the Coriolis force check box.
Study 1
In the Home toolbar, click  Compute.
Results
Mode Shape (solid)
The default plot now shows the scaled deformation for the first mode of vibration when the blade is rotating at 3000 RPM. In this case the first eigenmode also occurs at 124 Hz. This result shows that enabling the Coriolis effect in the equations does not change the first natural frequency appreciably compared to the previous case.
In the next section, you perform a parametric study of the effect of rotational velocity and use the results to generate a Campbell diagram.
Solid Mechanics (solid)
Rotating Frame 1
1
In the Model Builder window, under Component 1 (comp1)>Solid Mechanics (solid) click Rotating Frame 1.
2
In the Settings window for Rotating Frame, locate the Frame Acceleration Effect section.
3
Clear the Coriolis force check box.
Study 1
Parametric Sweep
1
In the Study toolbar, click  Parametric Sweep.
2
In the Settings window for Parametric Sweep, locate the Study Settings section.
3
4
Step 2: Eigenfrequency
1
In the Model Builder window, click Step 2: Eigenfrequency.
2
In the Settings window for Eigenfrequency, locate the Study Settings section.
3
In the Search for eigenfrequencies around text field, type 1000.
Compute one additional eigenfrequency to avoid the possibility that the solver converges on a higher-order mode.
4
Select the Desired number of eigenfrequencies check box.
5
6
In the Study toolbar, click  Compute.
Results
Mode Shape (solid) 1
The default plot shows the scaled displacement magnitude for the first mode for a rotational velocity of 30,000 RPM as a surface plot in Mode Shape (solid) 1. This mode occurs at a frequency of 723 Hz.
Use the Parameter value (Omega) and Eigenfrequency lists to find out the six lowest eigenfrequencies for each rotational velocity. A more elegant way to visualize this result is by creating a Campbell diagram.
1D Plot Group 3
1
In the Home toolbar, click  Add Plot Group and choose 1D Plot Group.
2
In the Settings window for 1D Plot Group, locate the Data section.
3
From the Dataset list, choose Study 1/Parametric Solutions 1 (sol3).
4
From the Eigenfrequency selection list, choose Manual.
Display the 6 lowest eigenfrequencies.
5
In the Eigenfrequency indices (1-7) text field, type range(1,1,6).
6
Click to expand the Title section. From the Title type list, choose Manual.
7
In the Title text area, type Campbell diagram for the six lowest modes.
8
Locate the Plot Settings section. Select the x-axis label check box.
9
In the associated text field, type Rotational angular velocity [rad/s].
10
Select the y-axis label check box.
11
12
Locate the Axis section. Select the Manual axis limits check box.
13
In the x minimum text field, type -100.
14
In the x maximum text field, type 4000.
15
In the y minimum text field, type 0.
16
In the y maximum text field, type 4500.
Global 1
1
Right-click 1D Plot Group 3 and choose Global.
2
In the Settings window for Global, click Replace Expression in the upper-right corner of the y-Axis Data section. From the menu, choose Component 1 (comp1)>Solid Mechanics>Global>solid.freq - Frequency - Hz.
3
Locate the x-Axis Data section. From the Axis source data list, choose Outer solutions.
4
Click to expand the Coloring and Style section. Find the Line style subsection. From the Line list, choose Cycle.
5
In the Width text field, type 4.
6
Click to expand the Legends section. From the Legends list, choose Manual.
7
Campbell diagram
1
In the Model Builder window, under Results click 1D Plot Group 3.
2
In the Settings window for 1D Plot Group, type Campbell diagram in the Label text field.
3
Locate the Legend section. From the Position list, choose Upper left.
4
In the Campbell diagram toolbar, click  Plot.