PDF

Tunable Liquid Gradient Refractive Index Lens
Introduction
A liquid graded refractive index (L-GRIN) lens can focus light purely by liquid flow, eliminating the need for mechanical or electrical light-manipulating mechanisms. In this example, a calcium chloride solution is mixed with distilled water; the resulting gradient in the concentration in CaCl2 creates a gradient in the refractive index in the channel, which focuses light from a fiber optic cable. The L-GRIN lens is tunable; by changing the flow rate of the distilled water, it is possible to control the refractive index distribution in the channel and change the location of the focal plane.
Model Definition
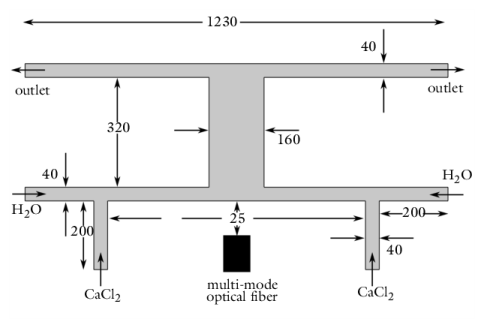
The lens device is composed of a PDMS (polydimethylsiloxane) substrate that has a channel, a first fluid path and a second fluid path, both made of two independent inlets and sharing two common outlets. The first and second fluid paths are merged in the channel to form laminar flows and establish a calcium chloride concentration distribution that resembles the hyperbolic secant profile; see Ref. 1. Figure 1 shows the 2D geometry and dimensions used for the simulation.
Figure 1: Devices schematics and dimensions (in μm).
An optical fiber light source, is positioned adjacent to the channel. The thickness of PDMS between the aperture of the optical fiber and the microfluidic channel is 25 μm. The wavelength of the source is 532 nm and the core diameter of the multi-mode optical fiber is 50 μm with a numerical aperture of 0.22.
The first fluid path uses a solution of calcium chloride (CaCl2) while the other fluid path uses distilled water. The two fluids have a different refractive index. The refractive index of the mixture depends linearly on the concentration profile in the channel and is defined by:
(1)
where c1 = 3.5 mol·l-1 and n1 = 1.41 are respectively the concentration and refractive index of the CaCl2 solution, and where n2 = 1.33 is the refractive index of the distilled water.
In this model, the flow rates of distilled water is varied from 0.6 to 3.0 μl·min-1 while the flow rate of the CaCl2 solution is kept constant at 3.0 μl·min-1.
Results and Discussion
The laminar fluid flow provides an optically smooth fluidic interface. Figure 2 and Figure 3 respectively shows the concentration of CaCl2 in the channel and the effect of the concentration profile on the mixture’s refractive index.
The curvature of the fluidic interface and, therefore, the focus point of the fluidic lens can be conveniently adjusted by simply changing the flow rates of the distilled water. Figure 4 shows the ray trajectories for a water flow rate of 3.0 μl·min-1.
Displaying Figure 4 for different flow rates shows that higher water flow rates result in larger refractive index contrast, which causes light to bend toward the lens axis more significantly and leads to the decreased focal distance.
Figure 5 shows the light intensity profiles for different flow rates as they reach the end of the channel. The maximum and smaller half-width maximum of the intensity is observed for a water flow rate of 2.4 μl·min-1.
Figure 2: Concentration of CaCl2 for a water flow rate of 3 μm/min.
Figure 3: Refractive Index of the mixture for a water flow rate of 3 μm/min.
Figure 4: Ray trajectories for a water flow rate of 3 μm/min.
Figure 5: Intensity profiles at the end of the microfluidic channel for different water flow rates.
Reference
1. X. Mao and others, “Tunable Liquid Gradient Refractive Index (L-GRIN) lens with two degrees of freedom,” Lab Chip, vol. 9, no. 14, pp. 2050–2058, 2009.
Application Library path: Ray_Optics_Module/Lenses_Cameras_and_Telescopes/tunable_liquid_gradient_refractive_index_lens
Modeling Instructions
From the File menu, choose New.
New
In the New window, click  Model Wizard.
Model Wizard
1
In the Model Wizard window, click  2D.
2
In the Select Physics tree, select Fluid Flow>Single-Phase Flow>Creeping Flow (spf).
3
Click Add.
4
In the Select Physics tree, select Chemical Species Transport>Transport of Diluted Species (tds).
5
Click Add.
6
Click  Study.
7
In the Select Study tree, select General Studies>Stationary.
8
Global Definitions
Parameters 1
1
In the Model Builder window, under Global Definitions click Parameters 1.
2
In the Settings window for Parameters, locate the Parameters section.
3
Click  Load from File.
4
Browse to the model’s Application Libraries folder and double-click the file tunable_liquid_gradient_refractive_index_lens_parameters.txt.
Definitions
Variables 1
1
In the Model Builder window, under Component 1 (comp1) right-click Definitions and choose Variables.
2
In the Settings window for Variables, locate the Variables section.
3
Click  Load from File.
4
Browse to the model’s Application Libraries folder and double-click the file tunable_liquid_gradient_refractive_index_lens_variables.txt.
Geometry 1
1
In the Model Builder window, under Component 1 (comp1) click Geometry 1.
2
In the Settings window for Geometry, locate the Units section.
3
From the Length unit list, choose µm.
Rectangle 1 (r1)
1
In the Geometry toolbar, click  Rectangle.
2
In the Settings window for Rectangle, locate the Size and Shape section.
3
In the Width text field, type w_sub.
4
In the Height text field, type h_sub.
5
Locate the Position section. From the Base list, choose Center.
Rectangle 2 (r2)
1
In the Geometry toolbar, click  Rectangle.
2
In the Settings window for Rectangle, locate the Size and Shape section.
3
In the Width text field, type (w_sub-w_chan)/2.
4
In the Height text field, type h_chan.
5
Locate the Position section. From the Base list, choose Center.
6
In the x text field, type -(w_chan+w_sub)/4.
7
In the y text field, type (h_sub-h_chan)/2-d_io.
Copy 1 (copy1)
1
In the Geometry toolbar, click  Transforms and choose Copy.
2
3
In the Settings window for Copy, locate the Displacement section.
4
In the x text field, type (w_sub+w_chan)/2.
Rectangle 3 (r3)
1
In the Geometry toolbar, click  Rectangle.
2
In the Settings window for Rectangle, locate the Size and Shape section.
3
In the Width text field, type l_in.
4
In the Height text field, type h_sub/3.
5
Locate the Position section. From the Base list, choose Center.
6
In the x text field, type -(w_sub-l_in)/2.
7
In the y text field, type -(h_sub-h_sub/3)/2.
Copy 2 (copy2)
1
In the Geometry toolbar, click  Transforms and choose Copy.
2
3
In the Settings window for Copy, locate the Displacement section.
4
In the x text field, type w_sub-l_in.
Rectangle 4 (r4)
1
In the Geometry toolbar, click  Rectangle.
2
In the Settings window for Rectangle, locate the Size and Shape section.
3
In the Width text field, type w_sub-2*(d_io+l_in).
4
In the Height text field, type h_sub/3.
5
Locate the Position section. From the Base list, choose Center.
6
In the y text field, type -(h_sub-h_sub/3)/2.
Difference 1 (dif1)
1
In the Geometry toolbar, click  Booleans and Partitions and choose Difference.
2
3
In the Settings window for Difference, locate the Difference section.
4
Find the Objects to subtract subsection. Select the  Activate Selection toggle button.
5
Select the objects copy1, copy2, r2, r3, and r4 only.
Line Segment 1 (ls1)
1
In the Geometry toolbar, click  More Primitives and choose Line Segment.
2
In the Settings window for Line Segment, locate the Starting Point section.
3
From the Specify list, choose Coordinates.
4
In the x text field, type -w_chan/2.
5
In the y text field, type h_sub/2.
6
Locate the Endpoint section. From the Specify list, choose Coordinates.
7
In the x text field, type w_chan/2.
8
In the y text field, type h_sub/2.
9
Click  Build All Objects.
Creeping Flow (spf)
Inlet 1
1
In the Model Builder window, under Component 1 (comp1) right-click Creeping Flow (spf) and choose Inlet.
2
3
In the Settings window for Inlet, locate the Boundary Condition section.
4
From the list, choose Fully developed flow.
5
Locate the Fully Developed Flow section. Click the Flow rate button.
6
In the V0 text field, type fr1.
7
In the Dz text field, type 100[um].
Inlet 2
1
In the Physics toolbar, click  Boundaries and choose Inlet.
2
3
In the Settings window for Inlet, locate the Boundary Condition section.
4
From the list, choose Fully developed flow.
5
Locate the Fully Developed Flow section. Click the Flow rate button.
6
In the V0 text field, type fr2.
7
In the Dz text field, type 100[um].
Outlet 1
1
In the Physics toolbar, click  Boundaries and choose Outlet.
2
Change the concentration discretization to quadratic in order to obtain a better evaluation of the concentration gradients.
Transport of Diluted Species (tds)
1
In the Model Builder window, under Component 1 (comp1) click Transport of Diluted Species (tds).
2
In the Settings window for Transport of Diluted Species, click to expand the Discretization section.
3
From the Concentration list, choose Quadratic.
Transport Properties 1
1
In the Model Builder window, under Component 1 (comp1)>Transport of Diluted Species (tds) click Transport Properties 1.
2
In the Settings window for Transport Properties, locate the Convection section.
3
From the u list, choose Velocity field (spf).
Concentration 1
1
In the Physics toolbar, click  Boundaries and choose Concentration.
2
3
In the Settings window for Concentration, locate the Concentration section.
4
Select the Species c check box.
5
In the c0,c text field, type c1.
Concentration 2
1
In the Physics toolbar, click  Boundaries and choose Concentration.
2
3
In the Settings window for Concentration, locate the Concentration section.
4
Select the Species c check box.
Outflow 1
1
In the Physics toolbar, click  Boundaries and choose Outflow.
2
Add Physics
1
In the Physics toolbar, click  Add Physics to open the Add Physics window.
2
Go to the Add Physics window.
3
In the tree, select Optics>Ray Optics>Geometrical Optics (gop).
4
Find the Physics interfaces in study subsection. In the table, clear the Solve check box for Study 1.
5
Click Add to Component 1 in the window toolbar.
6
In the Physics toolbar, click  Add Physics to close the Add Physics window.
Geometrical Optics (gop)
In order to avoid modeling reflections at the channel interface, set the Maximum number of secondary rays to zero.
1
In the Settings window for Geometrical Optics, locate the Material Properties of Exterior and Unmeshed Domains section.
2
In the next text field, type n_pdms.
3
Locate the Ray Release and Propagation section. In the Maximum number of secondary rays text field, type 0.
4
Locate the Intensity Computation section. From the Intensity computation list, choose Compute intensity in graded media.
Material Discontinuity 1
1
In the Model Builder window, under Component 1 (comp1)>Geometrical Optics (gop) click Material Discontinuity 1.
2
In the Settings window for Material Discontinuity, locate the Rays to Release section.
3
From the Release reflected rays list, choose Never.
Ray Properties 1
1
In the Model Builder window, click Ray Properties 1.
2
In the Settings window for Ray Properties, locate the Ray Properties section.
3
In the λ0 text field, type lambda0.
Release from Grid 1
1
In the Physics toolbar, click  Global and choose Release from Grid.
Use the projected direction of a three-dimesional cone release on the 2D plane in order to achieve a more realistic ray distribution.
2
In the Settings window for Release from Grid, locate the Initial Coordinates section.
3
In the qx,0 text field, type range(-1.0e-9,2.0e-9/(Np-1),1.0e-9).
4
In the qy,0 text field, type -100[um]-l_of-f.
5
Locate the Ray Direction Vector section. Specify the L0 vector as
Add an accumulator at the end of the channel in order to estimate the intenisty profiles at this location.
Material Discontinuity 2
1
In the Physics toolbar, click  Boundaries and choose Material Discontinuity.
2
3
In the Settings window for Material Discontinuity, locate the Rays to Release section.
4
From the Release reflected rays list, choose Never.
Accumulator 1
1
In the Physics toolbar, click  Attributes and choose Accumulator.
2
In the Settings window for Accumulator, locate the Accumulator Settings section.
3
In the R text field, type 1.
Add water as a material for the fluid properties and manually add the refractive index of the mixture in the property.
Add Material
1
In the Home toolbar, click  Add Material to open the Add Material window.
2
Go to the Add Material window.
3
In the tree, select Built-in>Water, liquid.
4
Click Add to Component in the window toolbar.
5
In the Home toolbar, click  Add Material to close the Add Material window.
Materials
Water, liquid (mat1)
1
In the Settings window for Material, locate the Material Contents section.
2
Mesh 1
1
In the Model Builder window, under Component 1 (comp1) click Mesh 1.
2
In the Settings window for Mesh, locate the Physics-Controlled Mesh section.
3
From the Element size list, choose Extra fine.
4
Click  Build All.
Study 1
Ray Tracing
1
In the Study toolbar, click  Study Steps and choose Time Dependent>Ray Tracing.
2
In the Settings window for Ray Tracing, locate the Study Settings section.
3
From the Time-step specification list, choose Specify maximum path length.
4
In the Lengths text field, type range(0,0.1,1)*2*h_sub.
5
Locate the Physics and Variables Selection section. In the table, clear the Solve for check boxes for Creeping Flow (spf) and Transport of Diluted Species (tds).
6
Click to expand the Values of Dependent Variables section. Find the Values of variables not solved for subsection. From the Settings list, choose User controlled.
7
From the Method list, choose Solution.
8
From the Study list, choose Study 1, Stationary.
Parametric Sweep
1
In the Study toolbar, click  Parametric Sweep.
2
In the Settings window for Parametric Sweep, locate the Study Settings section.
3
4
5
Click  Range.
6
In the Range dialog box, type 0.6 in the Start text field.
7
In the Step text field, type 0.6.
8
In the Stop text field, type 3.
9
Click Add.
Set the time-stepping method to manual for better accuracy.
Solution 1 (sol1)
1
In the Study toolbar, click  Show Default Solver.
2
In the Model Builder window, expand the Solution 1 (sol1) node, then click Time-Dependent Solver 1.
3
In the Settings window for Time-Dependent Solver, click to expand the Time Stepping section.
4
From the Steps taken by solver list, choose Manual.
5
In the Time step text field, type tstep.
6
In the Model Builder window, click Study 1.
7
In the Settings window for Study, locate the Study Settings section.
8
Clear the Generate default plots check box.
9
In the Study toolbar, click  Compute.
Results
In the Model Builder window, expand the Results node.
Ray 1
1
In the Model Builder window, expand the Results>Datasets node.
2
Right-click Results>Datasets and choose More Datasets>Ray.
3
In the Settings window for Ray, locate the Ray Solution section.
4
From the Solution list, choose Parametric Solutions 1 (sol3).
Concentration
1
In the Results toolbar, click  2D Plot Group.
2
In the Settings window for 2D Plot Group, type Concentration in the Label text field.
3
Locate the Data section. From the Dataset list, choose Study 1/Parametric Solutions 1 (sol3).
Surface 1
1
Right-click Concentration and choose Surface.
2
In the Settings window for Surface, locate the Expression section.
3
In the Expression text field, type c.
4
In the Concentration toolbar, click  Plot.
5
Click the  Zoom Extents button in the Graphics toolbar. The plot should look like Figure 2.
Refractive Index
1
In the Model Builder window, right-click Concentration and choose Duplicate.
2
In the Settings window for 2D Plot Group, type Refractive Index in the Label text field.
Surface 1
1
In the Model Builder window, expand the Refractive Index node, then click Surface 1.
2
In the Settings window for Surface, locate the Expression section.
3
In the Expression text field, type n.
4
In the Refractive Index toolbar, click  Plot.
5
Click the  Zoom Extents button in the Graphics toolbar. The plot should look like Figure 3. Select a different parameter value to see the effect of the water flow rate on the refractive index of the lens.
Ray Trajectories
1
In the Home toolbar, click  Add Plot Group and choose 2D Plot Group.
2
In the Settings window for 2D Plot Group, type Ray Trajectories in the Label text field.
3
Locate the Data section. From the Dataset list, choose Ray 1.
Ray Trajectories 1
In the Ray Trajectories toolbar, click  More Plots and choose Ray Trajectories.
Color Expression 1
1
Right-click Ray Trajectories 1 and choose Color Expression.
2
In the Settings window for Color Expression, click Replace Expression in the upper-right corner of the Expression section. From the menu, choose Component 1 (comp1)>Geometrical Optics>Intensity and polarization>gop.logI - Log of intensity.
3
In the Ray Trajectories toolbar, click  Plot.
4
Click the  Zoom Extents button in the Graphics toolbar. The plot should look like Figure 4. Select a different parameter value to see the effect of the water flow rate on the focal length of the lens.
Intensity Profiles
1
In the Home toolbar, click  Add Plot Group and choose 1D Plot Group.
2
In the Settings window for 1D Plot Group, locate the Data section.
3
From the Dataset list, choose Study 1/Parametric Solutions 1 (sol3).
4
From the Time selection list, choose Last.
5
In the Label text field, type Intensity Profiles.
Line Graph 1
1
Right-click Intensity Profiles and choose Line Graph.
2
Click the  Zoom Extents button in the Graphics toolbar.
3
4
In the Settings window for Line Graph, click Replace Expression in the upper-right corner of the y-axis data section. From the menu, choose Component 1 (comp1)>Geometrical Optics>Accumulated variables>Accumulated variable comp1.gop.matd2.bacc1.rpb>gop.matd2.bacc1.rpb - Accumulated variable rpb.
5
Click to expand the Legends section. Select the Show legends check box.
6
In the Intensity Profiles toolbar, click  Plot.
7
Click the  Zoom Extents button in the Graphics toolbar. The plot should look like Figure 5.