PDF

Hubble Space Telescope
Introduction
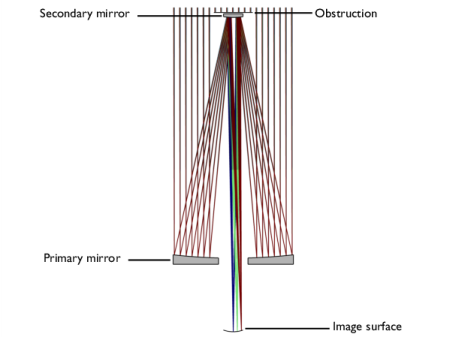
The Hubble Space Telescope (HST) is an example of a standard Cassegrain telescope. This tutorial demonstrates how to use the Conic Mirror On Axis 3D part from the Part Libraries to construct the HST Ritchey-Chrétien geometry, and how to include multiple ray release features so that rays at several field angles can be traced simultaneously. An overview of the HST is shown in Figure 1.
Figure 1: Overview of the Hubble Space Telescope.
Model Definition
Details of the Hubble Space Telescope can be found in Ref. 1 and Ref. 2. This is the nominal pre-launch design. In this tutorial the as-built details (see, for example, Ref. 3 and Ref. 4) are not considered, but additional information from these references was used to create the model. A summary of the HST parameters used in this tutorial is given in Table 1.
In this simulation the telescope geometry is constructed using two instances of the Conic Mirror On Axis 3D from the Part Libraries. The image surface is defined using a Parametric Surface primitive with the appropriate Petzval curvature. A secondary obstruction has been created using an instance of the Circular Planar Annulus 3D which can also be found in the Part Libraries. The resulting Hubble Space Telescope geometry sequence is shown in Figure 2.
 
λvac
550 nm
θx,i
Nominal x field angle, field i = 1,2,3
θy,i
Nominal y field angle, field i = 1,2,3
Nring
10
Pnom
2400.0 mm
Rprim
-11040.0 mm
kprim
-1.0022985
d0,prim
2450.0 mm
dh,prim
600.0 mm
Tc,prim
125.0 mm
Rsec
1358.000 mm
ksec
-1.49600
dsec
395.0 mm
Tc,sec
75.0 mm
Zprim
0 mm
Zsec
-4906.071 mm
Zbfl
1500.0 mm
Zimage
Zsec Zbfl
εobs
0.33
Cp
Figure 2: The Hubble Space Telescope geometry sequence.
Figure 3: The Hubble Space Telescope mesh.
Results and Discussion
A ray trace has been performed at a single wavelength (550 nm) at three field angles (0, 5 and 10 arcminutes). Figure 4 shows the resulting ray trajectories; the Color Expression represents the ray positions on the image surface.
In Figure 5 the intersection of the rays with the image surface is shown. This spot diagram shows each of the three field angles, where the Color Expression is the initial radial location at the entrance pupil.
Figure 4: Ray diagram of the HST colored by radial distance from the centroid.
Figure 5: Spot diagram of the HST colored by radial distance from the center of the entrance pupil. The absolute coordinate of each spot is shown. The ring in the lower-left corner is the nominal Airy ring.
References
1. C. Burrows, Hubble Space Telescope: Optical telescope assembly handbook. Space Telescope Science Inst., Baltimore, MD, 1990.
2. D. Schroeder, Astronomical Optics. Second Edition. San Diego, CA, USA: Academic Press, 2000.
3. D. Moore and others, Final Report Hubble Independent Optical Review Panel. Goddard Space Flight Center, Greenbelt, MD, 1991.
4. L. Allen and others, The Hubble Space Telescope Optical Systems Failure Report. NASA, 1990.
Application Library path: Ray_Optics_Module/Lenses_Cameras_and_Telescopes/hubble_space_telescope
Modeling Instructions
From the File menu, choose New.
New
In the New window, click  Model Wizard.
Model Wizard
1
In the Model Wizard window, click  3D.
2
In the Select Physics tree, select Optics>Ray Optics>Geometrical Optics (gop).
3
Click Add.
4
Click  Study.
5
In the Select Study tree, select Preset Studies for Selected Physics Interfaces>Ray Tracing.
6
Global Definitions
Parameters 1
1
In the Model Builder window, under Global Definitions click Parameters 1.
2
In the Settings window for Parameters, locate the Parameters section.
3
Click  Load from File.
4
Component 1 (comp1)
1
In the Model Builder window, click Component 1 (comp1).
2
In the Settings window for Component, locate the General section.
3
Find the Mesh frame coordinates subsection. From the Geometry shape function list, choose Cubic Lagrange. The ray tracing algorithm used by the Geometrical Optics interface computes the refracted ray direction based on a discretized geometry via the underlying finite element mesh. A cubic geometry shape order usually introduces less discretization error compared to the default, which uses linear and quadratic polynomials.
Part Libraries
1
In the Home toolbar, click  Windows and choose Part Libraries.
2
In the Model Builder window, under Component 1 (comp1) click Geometry 1.
3
In the Part Libraries window, select Ray Optics Module>3D>Mirrors>conic_mirror_on_axis_3d in the tree.
4
Click  Add to Geometry.
5
In the Select Part Variant dialog box, select Specify clear aperture diameter in the Select part variant list.
6
Geometry 1
Primary Mirror
1
In the Model Builder window, under Component 1 (comp1)>Geometry 1 click Conic Mirror On Axis 3D 1 (pi1).
2
In the Settings window for Part Instance, type Primary Mirror in the Label text field.
3
Locate the Input Parameters section. In the table, enter the following settings:
4
Locate the Position and Orientation of Output section. Find the Displacement subsection. In the zw text field, type Z_prim.
5
Click  Build Selected.
6
Click to expand the Boundary Selections section. In the table, select the Keep check box for Mirror surface.
7
8
Click New Cumulative Selection.
9
In the New Cumulative Selection dialog box, type Obstructions in the Name text field.
10
11
In the Settings window for Part Instance, locate the Boundary Selections section.
12
Secondary Mirror
1
In the Geometry toolbar, click  Parts and choose Conic Mirror On Axis 3D.
2
In the Settings window for Part Instance, type Secondary Mirror in the Label text field.
3
Locate the Input Parameters section. In the table, enter the following settings:
4
Locate the Position and Orientation of Output section. Find the Coordinate system to match subsection. From the Take work plane from list, choose Primary Mirror (pi1).
5
From the Work plane list, choose Mirror vertex intersection (wp1).
6
Find the Displacement subsection. In the zw text field, type Z_sec.
7
Click  Build Selected.
8
Locate the Boundary Selections section. In the table, enter the following settings:
Image Surface
A parametric surface can be used to define the image surface.
1
In the Geometry toolbar, click  More Primitives and choose Parametric Surface.
2
In the Settings window for Parametric Surface, type Image Surface in the Label text field.
3
Locate the Parameters section. Find the First parameter subsection. In the Minimum text field, type -hw_image.
4
In the Maximum text field, type hw_image.
5
Find the Second parameter subsection. In the Minimum text field, type -hw_image.
6
In the Maximum text field, type hw_image.
7
Locate the Expressions section. In the x text field, type s1.
8
In the y text field, type s2.
9
In the z text field, type Cp*(s1^2 + s2^2)/(1 + sqrt(1 - Cp^2*(s1^2 + s2^2)))*1[m]. This is the equation of a sphere having a curvature Cp. This is the Petzval curvature defined in the Parameters node.
10
Locate the Position section. In the z text field, type Z_image.
11
Locate the Coordinate System section. From the Take work plane from list, choose Secondary Mirror (pi2).
12
From the Work plane list, choose Mirror vertex intersection (wp1).
13
Locate the Selections of Resulting Entities section. Select the Resulting objects selection check box.
Part Libraries
The secondary mirror mount creates an obstruction.
1
In the Geometry toolbar, click  Parts and choose Part Libraries.
2
In the Model Builder window, click Geometry 1.
3
In the Part Libraries window, select Ray Optics Module>3D>Apertures and Obstructions>circular_planar_annulus in the tree.
4
Click  Add to Geometry.
Geometry 1
Secondary Obstruction
1
In the Model Builder window, under Component 1 (comp1)>Geometry 1 click Circular Planar Annulus 1 (pi3).
2
In the Settings window for Part Instance, type Secondary Obstruction in the Label text field.
3
Locate the Input Parameters section. In the table, enter the following settings:
4
Locate the Position and Orientation of Output section. Find the Coordinate system to match subsection. From the Take work plane from list, choose Secondary Mirror (pi2).
5
From the Work plane list, choose Mirror vertex intersection (wp1).
6
Find the Displacement subsection. In the zw text field, type Z_obs.
7
Locate the Boundary Selections section. In the table, enter the following settings:
8
Click  Build Selected.
9
Click the  Go to Default View button in the Graphics toolbar.
10
Click the  Orthographic Projection button in the Graphics toolbar.
11
Click the  Zoom Extents button in the Graphics toolbar. Compare the resulting geometry to Figure 2.
Geometrical Optics (gop)
1
In the Model Builder window, under Component 1 (comp1) click Geometrical Optics (gop).
2
In the Settings window for Geometrical Optics, locate the Domain Selection section.
3
Click  Clear Selection.
4
Locate the Ray Release and Propagation section. In the Maximum number of secondary rays text field, type 0.
5
Select the Use geometry normals for ray-boundary interactions check box. In this simulation, the geometry normals are used to apply the boundary conditions on all refracting surfaces. This is appropriate for the highest accuracy ray traces in single-physics simulations, where the geometry is not deformed.
Primary
1
In the Physics toolbar, click  Boundaries and choose Mirror.
2
In the Settings window for Mirror, type Primary in the Label text field.
3
Locate the Boundary Selection section. From the Selection list, choose Mirror surface (Primary Mirror).
Secondary
1
In the Physics toolbar, click  Boundaries and choose Mirror.
2
In the Settings window for Mirror, type Secondary in the Label text field.
3
Locate the Boundary Selection section. From the Selection list, choose Mirror surface (Secondary Mirror).
Obstructions
1
In the Physics toolbar, click  Boundaries and choose Wall.
2
In the Settings window for Wall, type Obstructions in the Label text field.
3
Locate the Boundary Selection section. From the Selection list, choose Obstructions.
4
Locate the Wall Condition section. From the Wall condition list, choose Disappear.
Image
1
In the Physics toolbar, click  Boundaries and choose Wall.
2
In the Settings window for Wall, type Image in the Label text field.
3
Locate the Boundary Selection section. From the Selection list, choose Image Surface.
Release from Grid 1
Next, create three release features for each of the field angles defined in the Parameters node.
1
In the Physics toolbar, click  Global and choose Release from Grid.
2
In the Settings window for Release from Grid, locate the Initial Coordinates section.
3
From the Grid type list, choose Hexapolar.
4
Specify the qc vector as
5
Specify the rc vector as
6
In the Rc text field, type P_nom/2.
7
In the Nc text field, type N_ring.
8
Locate the Ray Direction Vector section. Specify the L0 vector as
Release from Grid 2
1
Right-click Release from Grid 1 and choose Duplicate.
2
In the Settings window for Release from Grid, locate the Initial Coordinates section.
3
Specify the qc vector as
4
Locate the Ray Direction Vector section. Specify the L0 vector as
Release from Grid 3
1
Right-click Release from Grid 2 and choose Duplicate.
2
In the Settings window for Release from Grid, locate the Initial Coordinates section.
3
Specify the qc vector as
4
Locate the Ray Direction Vector section. Specify the L0 vector as
Mesh 1
Adjust the default mesh to improve the geometry discretization.
1
In the Model Builder window, under Component 1 (comp1) click Mesh 1.
2
In the Settings window for Mesh, locate the Physics-Controlled Mesh section.
3
From the Element size list, choose Extremely fine.
4
Click  Build All. The mesh should looks like Figure 3.
Study 1
Step 1: Ray Tracing
1
In the Model Builder window, under Study 1 click Step 1: Ray Tracing.
2
In the Settings window for Ray Tracing, locate the Study Settings section.
3
From the Time-step specification list, choose Specify maximum path length.
4
In the Lengths text field, type 0 17. This path length is sufficient to ensure that all rays reach the image plane.
5
In the Home toolbar, click  Compute.
Now, create a ray diagram.
Results
Ray Diagram
1
In the Settings window for 3D Plot Group, type Ray Diagram in the Label text field.
2
Click to expand the Title section. From the Title type list, choose None.
3
Locate the Color Legend section. Select the Show maximum and minimum values check box.
4
Select the Show units check box.
5
In the Model Builder window, expand the Ray Diagram node.
Color Expression 1
1
In the Model Builder window, expand the Results>Ray Diagram>Ray Trajectories 1 node, then click Color Expression 1.
2
In the Settings window for Color Expression, locate the Expression section.
3
In the Expression text field, type at('last',gop.rrel). This is the radial coordinate relative to the centroid at the image plane for each release feature.
4
From the Unit list, choose µm.
Volume 1
1
In the Model Builder window, right-click Ray Diagram and choose Volume.
2
In the Settings window for Volume, locate the Coloring and Style section.
3
From the Coloring list, choose Uniform.
4
From the Color list, choose Gray.
5
In the Ray Diagram toolbar, click  Plot.
6
Click the  Zoom Extents button in the Graphics toolbar. Compare the resulting image to Figure 4.
Spot Diagram
Next, create a spot diagram.
1
In the Home toolbar, click  Add Plot Group and choose 2D Plot Group.
2
In the Settings window for 2D Plot Group, type Spot Diagram in the Label text field.
3
Locate the Color Legend section. Select the Show units check box.
Spot Diagram 1
1
In the Spot Diagram toolbar, click  More Plots and choose Spot Diagram.
2
In the Settings window for Spot Diagram, locate the Layout section.
3
From the Layout list, choose Rectangular grid.
4
In the Horizontal padding factor text field, type 0.
5
Click to expand the Annotations section. Select the Show circle check box.
6
In the Radius text field, type r_Airy.
Color Expression 1
1
Right-click Spot Diagram 1 and choose Color Expression.
2
In the Settings window for Color Expression, locate the Expression section.
3
In the Expression text field, type at(0,gop.rrel). This is the radial coordinate relative to the centroid at the entrance pupil for each ray release.
4
In the Spot Diagram toolbar, click  Plot.
5
Click the  Zoom Extents button in the Graphics toolbar. Compare the resulting image to Figure 5.