PDF

Transient Analysis of a Printed Dual-Band Strip Antenna
Introduction
A wideband antenna study, such as an S-parameter or far-field pattern analysis, can be obtained by performing a transient response analysis and a time-to-frequency fast Fourier transform (FFT). This model runs a time dependent study first and then transforms the dependent variable, the magnetic vector potential A, and a voltage signal at a lumped port from time domain to frequency domain. S-parameters and far-field radiation data are generated from the frequency domain data. The computed S-parameters shows two resonance in the given frequency range, as expected for this dual-band antenna design.
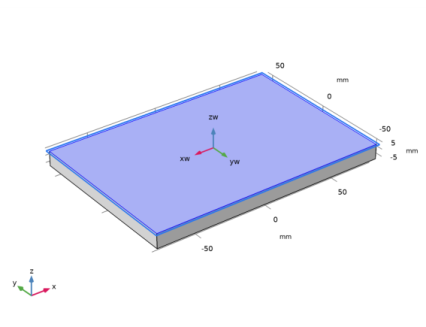
Figure 1: Printed dual-band antenna strip. The surrounding air domain is not included for visualization purposes.
Model Definition
A metallic strip modeled as perfect electric conductor (PEC) is patterned on a dielectric block. A low permittivity value of εr = 1.05 is used for the dielectric block to describe a polystyrene foam board. A lumped port with 50 Ω characteristic impedance is added on a small rectangular surface in the middle of the strip to excite the antenna structure. The antenna is enclosed by a spherical air domain. The exterior surfaces of the air are finished by a scattering boundary condition that is an absorbing boundary to describe an open radiating space. On these surfaces, the near field to far field transformation is executed in the frequency domain.
In the lumped port settings window, by clicking the check box “Calculate S-parameter” on the excitation port, the voltage excitation type is set to the modulated Gaussian and the center frequency (f0) of the modulating sinusoidal function can be specified. The modulated Gaussian excitation voltage is defined as:
where σ is the standard deviation 1/2f0, f0 is the center frequency and ηf is the modulating frequency shift ratio. A small ratio value, for example 3 %, of ηf may enhance the frequency response around the highest frequency.
The frequency here has to be matched to the center frequency of the S-parameter calculation used in the Time to Frequency FFT study step. The end time of the Time Dependent study step is set to 100 times of the period of the modulating sinusoidal function, which is long enough in this model to ensure that the input energy is fully decayed. This would work for a typical passive circuit except for closed cavity type devices, where the energy decay time can be much longer. The stop condition is automatically added under the Time-Dependent solver (the Calculate S-parameter check box activates this stop condition in the solver settings). When the sum of total electric and magnetic energy in the modeling domain is less than 70 dB compared to the input energy, the Time Dependent study is terminated by the stop condition and all time-domain data will be passed to the FFT step. To generate the frequency-domain data without significant distortion in the frequency range between 0 and 2f0, the time step, satisfying the Nyquist criterion, is set to 1/4f0 = 1/2B, where B is the bandwidth 2f0.
To provide a fine frequency resolution, the end time of the FFT study step is much longer than that of the Time Dependent study. Zero-padding is applied to the Time Dependent study data before the FFT study step.
Results and Discussion
The electric field norm on top of the dielectric block is plotted at the first antenna resonance frequency in Figure 2. It is observed that the electric field reacts with the entire metallic strip structure when the frequency is around the first resonance. The S-parameters up to 3 GHz in Figure 3 shows two resonance regions where the computed S11 is below -10 dB. While the far-field radiation pattern around the low frequency resonance is isotropic on the H-plane, which resembles that of a half-wave dipole antenna, the radiation characteristic at the high frequency resonance shows a higher directivity toward the up and downside of the dielectric block as shown in Figure 4.
Figure 2: The electric field norm distribution on top of the dielectric board. The resonance behavior is observed at each tip of the printed strip.
Figure 3: The S-parameter plot describes two resonances where S11 is less than -10 dB.
Figure 4: The 3D far-field radiation pattern around the first (top) and second resonance (bottom). The directivity at the second resonance is stronger than that at the first resonance.
Notes About the COMSOL Implementation
The time to frequency fast Fourier transform (FFT) study step transforms the solution of dependent variables in time domain to frequency domain. After running the FFT, only the postprocessing variables that can be expressed with the dependent variables and far-field variables in the frequency domain are valid for the result analysis. Since the solutions are typically transformed with a very small frequency step, it is recommended to use the Store field in output option to reduce the size of the model.
Application Library path: RF_Module/Antennas/dual_band_antenna_transient
Modeling Instructions
From the File menu, choose New.
New
In the New window, click  Model Wizard.
Model Wizard
1
In the Model Wizard window, click  3D.
2
In the Select Physics tree, select Radio Frequency>Electromagnetic Waves, Transient (temw).
3
Click Add.
4
Click  Study.
5
In the Select Study tree, select Preset Studies for Selected Physics Interfaces>Time Dependent with FFT.
6
Global Definitions
Parameters 1
1
In the Model Builder window, under Global Definitions click Parameters 1.
2
In the Settings window for Parameters, locate the Parameters section.
3
Geometry 1
Block 1 (blk1)
1
In the Geometry toolbar, click  Block.
2
In the Model Builder window, click Geometry 1.
3
In the Settings window for Geometry, locate the Units section.
4
From the Length unit list, choose mm.
First, create a block for a dielectric layer.
5
In the Model Builder window, click Block 1 (blk1).
6
In the Settings window for Block, locate the Size and Shape section.
7
In the Width text field, type 160.
8
In the Depth text field, type 110.
9
In the Height text field, type 10.
10
Locate the Position section. From the Base list, choose Center.
Add a work plane where the printed antenna will be placed.
Work Plane 1 (wp1)
1
In the Geometry toolbar, click  Work Plane.
2
In the Settings window for Work Plane, locate the Plane Definition section.
3
From the Plane type list, choose Face parallel.
4
On the object blk1, select Boundary 4 only.
It might be easier to select the correct boundary by using the Selection List window. To open this window, in the Home toolbar click Windows and choose Selection List. (If you are running the cross-platform desktop, you find Windows in the main menu.)
Work Plane 1 (wp1)>Plane Geometry
In the Model Builder window, click Plane Geometry.
Draw the antenna strip.
Work Plane 1 (wp1)>Rectangle 1 (r1)
1
In the Work Plane toolbar, click  Rectangle.
2
In the Settings window for Rectangle, locate the Size and Shape section.
3
In the Width text field, type 5.
4
In the Height text field, type 10.
5
Locate the Position section. From the Base list, choose Center.
Work Plane 1 (wp1)>Rectangle 2 (r2)
1
In the Work Plane toolbar, click  Rectangle.
2
In the Settings window for Rectangle, locate the Size and Shape section.
3
In the Width text field, type 50.
4
In the Height text field, type 10.
5
Locate the Position section. From the Base list, choose Center.
6
Click  Build Selected.
Work Plane 1 (wp1)>Rectangle 3 (r3)
1
In the Work Plane toolbar, click  Rectangle.
2
In the Settings window for Rectangle, locate the Size and Shape section.
3
In the Width text field, type 5.
4
In the Height text field, type 60.
5
Locate the Position section. In the xw text field, type -30.
6
In the yw text field, type -30.
Work Plane 1 (wp1)>Rectangle 4 (r4)
1
In the Work Plane toolbar, click  Rectangle.
2
In the Settings window for Rectangle, locate the Size and Shape section.
3
In the Width text field, type 45.
4
In the Height text field, type 5.
5
Locate the Position section. In the xw text field, type -70.
6
In the yw text field, type 30.
Work Plane 1 (wp1)>Rectangle 5 (r5)
1
In the Work Plane toolbar, click  Rectangle.
2
In the Settings window for Rectangle, locate the Size and Shape section.
3
In the Width text field, type 45.
4
In the Height text field, type 5.
5
Locate the Position section. In the xw text field, type -70.
6
In the yw text field, type -35.
7
Click  Build Selected.
Work Plane 1 (wp1)>Mirror 1 (mir1)
1
In the Work Plane toolbar, click  Transforms and choose Mirror.
2
Select the objects r3, r4, and r5 only.
3
In the Settings window for Mirror, locate the Input section.
4
Select the Keep input objects check box.
5
Click  Build Selected.
Add a sphere for the surrounding air domain.
Sphere 1 (sph1)
1
In the Model Builder window, right-click Geometry 1 and choose Sphere.
2
In the Settings window for Sphere, locate the Size section.
3
In the Radius text field, type 120.
4
Click  Build All Objects.
Choose wireframe rendering to get a better view of the interior parts.
5
Click the  Wireframe Rendering button in the Graphics toolbar.
Add Material
1
In the Home toolbar, click  Add Material to open the Add Material window.
2
Go to the Add Material window.
3
4
Click Add to Component in the window toolbar.
5
In the Home toolbar, click  Add Material to close the Add Material window.
Materials
Material 2 (mat2)
1
In the Model Builder window, under Component 1 (comp1) right-click Materials and choose Blank Material.
2
3
In the Settings window for Material, locate the Material Contents section.
4
Electromagnetic Waves, Transient (temw)
Perfect Electric Conductor 2
1
In the Model Builder window, under Component 1 (comp1) right-click Electromagnetic Waves, Transient (temw) and choose Perfect Electric Conductor.
2
All metallic parts are set to PEC.
Lumped Port 1
1
In the Physics toolbar, click  Boundaries and choose Lumped Port.
2
3
In the Settings window for Lumped Port, locate the Lumped Port Properties section.
4
Select the Calculate S-parameter check box.
5
In the f0 text field, type f0.
The center frequency of the modulated Gaussian pulse is f0 that is defined in Parameters node. For the first port, wave excitation is on by default.
Far-Field Domain 1
1
In the Physics toolbar, click  Domains and choose Far-Field Domain.
2
In the Settings window for Far-Field Domain, locate the Domain Selection section.
3
4
Click  Remove from Selection.
5
The far-field domain includes only the air region.
Scattering Boundary Condition 1
1
In the Physics toolbar, click  Boundaries and choose Scattering Boundary Condition.
2
The exterior boundaries is used to absorb the outgoing wave.
Mesh 1
1
In the Model Builder window, under Component 1 (comp1) right-click Mesh 1 and choose Build All.
Hide some boundaries from the view. This helps to see the interior parts when reviewing the mesh.
2
Click the  Click and Hide button in the Graphics toolbar.
3
4
5
Click the  Click and Hide button in the Graphics toolbar.
6
In the Settings window for Mesh, locate the Mesh Settings section.
7
From the Sequence type list, choose User-controlled mesh.
Size 1
1
Right-click Component 1 (comp1)>Mesh 1 and choose Size.
2
Right-click Size 1 and choose Move Up.
3
In the Settings window for Size, locate the Geometric Entity Selection section.
4
From the Geometric entity level list, choose Boundary.
5
Use Finer on the lumped port boundary.
6
Locate the Element Size section. From the Predefined list, choose Finer.
Size
1
In the Model Builder window, click Size.
2
In the Settings window for Size, locate the Element Size section.
3
Click the Custom button.
4
Locate the Element Size Parameters section. In the Maximum element size text field, type c_const/f0/5.
The maximum mesh size is 0.2 wavelengths at the center frequency.
5
Click  Build All.
Electromagnetic Waves, Transient (temw)
Lumped Port 1
1
In the Model Builder window, under Component 1 (comp1)>Electromagnetic Waves, Transient (temw) click Lumped Port 1.
2
In the Settings window for Lumped Port, locate the Boundary Selection section.
3
Click  Create Selection.
The added selection will be used to define where to store the results.
4
In the Create Selection dialog box, click OK.
Far-Field Calculation 1
1
In the Model Builder window, expand the Component 1 (comp1)>Electromagnetic Waves, Transient (temw)>Far-Field Domain 1 node, then click Far-Field Calculation 1.
2
In the Settings window for Far-Field Calculation, locate the Boundary Selection section.
3
Click  Create Selection.
The added selection will be used to define where to store and visualize the results for the far-field radiation pattern.
4
In the Create Selection dialog box, click OK.
Definitions
Explicit 3
1
In the Definitions toolbar, click  Explicit.
2
In the Settings window for Explicit, locate the Input Entities section.
3
From the Geometric entity level list, choose Boundary.
4
The model evaluates the solution on these boundaries in time and frequency domain.
Study 1
Step 1: Time Dependent
1
In the Model Builder window, under Study 1 click Step 1: Time Dependent.
2
In the Settings window for Time Dependent, locate the Study Settings section.
3
In the Output times text field, type range(0,1/(4*f0),Tend). The Sampling rate 4*f0 satisfies the Nyquist condition for the time to frequency fast Fourier transform (FFT) where its bandwidth is 2*f0 excluding negative frequencies.
4
Click to expand the Values of Dependent Variables section. Find the Store fields in output subsection. From the Settings list, choose For selections.
5
Under Selections, click  Add.
6
In the Add dialog box, in the Selections list, choose Explicit 1, Explicit 2, and Explicit 3.
7
By choosing only the boundaries of interest for Store fields in output settings, it is possible to reduce the size of a model file a lot. It is necessary to include the port boundaries to calculate S-parameters and far-field calculation boundaries for visualizing the radiation pattern.
Step 2: Time to Frequency FFT
1
In the Model Builder window, click Step 2: Time to Frequency FFT.
2
In the Settings window for Time to Frequency FFT, locate the Study Settings section.
3
In the End time text field, type Tend*3. This makes sure that the FFT end time is longer than the simulation time so zero-padding can be applied during the time to frequency FFT. This will generate a finer frequency resolution in the resulting frequency response.
4
In the Maximum output frequency text field, type 2*f0.
5
Click to expand the Values of Dependent Variables section. Find the Store fields in output subsection. From the Settings list, choose For selections.
6
Under Selections, click  Add.
7
In the Add dialog box, in the Selections list, choose Explicit 1, Explicit 2, and Explicit 3.
8
Step 3: Combine Solutions
1
In the Model Builder window, click Step 3: Combine Solutions.
2
In the Settings window for Combine Solutions, locate the Combine Solutions Settings section.
3
In the Excluded if text field, type freq<0.1*f0 || freq>2*f0-0.1*f0. This excludes the first 5% and last 5% of the frequency response after FFT.
4
In the Home toolbar, click  Compute.
Results
3D Plot Group 1
1
In the Settings window for 3D Plot Group, locate the Data section.
2
From the Parameter value (freq (Hz)) list, choose 7.1E8.
Multislice 1
1
In the Model Builder window, expand the 3D Plot Group 1 node.
2
Right-click Multislice 1 and choose Disable.
Surface 1
1
In the Model Builder window, right-click 3D Plot Group 1 and choose Surface.
2
In the Settings window for Surface, locate the Coloring and Style section.
3
From the Color table list, choose AuroraAustralis.
Selection 1
1
Right-click Surface 1 and choose Selection.
2
In the Settings window for Selection, locate the Selection section.
3
From the Selection list, choose Explicit 3.
4
In the 3D Plot Group 1 toolbar, click  Plot.
Strong electric fields are observed on the antenna strip when it is resonant. See Figure 2.
S-parameter (temw)
Compare the reproduced plot to Figure 3. Two resonances are observed in the simulated frequency range.
Smith Plot (temw)
2D Far Field (temw)
1
In the Model Builder window, click 2D Far Field (temw).
2
In the Settings window for Polar Plot Group, locate the Data section.
3
From the Parameter selection (freq) list, choose From list.
4
In the Parameter values (freq (Hz)) list, select 7.2E8.
5
In the 2D Far Field (temw) toolbar, click  Plot.
It is the far-field radiation pattern in a polar plot around the first resonance. This E-plane radiation pattern resembles that of a dipole antenna.
3D Far Field (temw)
1
In the Model Builder window, click 3D Far Field (temw).
2
In the Settings window for 3D Plot Group, locate the Data section.
3
From the Parameter value (freq (Hz)) list, choose 7.2E8.
4
In the 3D Far Field (temw) toolbar, click  Plot.
5
Click the  Zoom Extents button in the Graphics toolbar.
Radiation Pattern 1
1
In the Model Builder window, expand the 3D Far Field (temw) node, then click Radiation Pattern 1.
2
In the Settings window for Radiation Pattern, locate the Evaluation section.
3
Find the Angles subsection. In the Number of azimuth angles text field, type 180.
4
In the Number of elevation angles text field, type 180.
5
Locate the Coloring and Style section. From the Color table list, choose HeatCameraLight.
6
From the Grid list, choose Finer.
7
From the Color list, choose Red.
8
In the 3D Far Field (temw) toolbar, click  Plot.
Table
1
Go to the Table window.
Figure 4 (top) shows the far-field radiation pattern at the chosen frequency.
Results
3D Far Field (temw)
1
In the Model Builder window, under Results click 3D Far Field (temw).
2
In the Settings window for 3D Plot Group, locate the Data section.
3
From the Parameter value (freq (Hz)) list, choose 2.265E9.
4
In the 3D Far Field (temw) toolbar, click  Plot.
5
Click the  Zoom Extents button in the Graphics toolbar.
Figure 4 (bottom) shows the far-field radiation pattern at the chosen frequency.