PDF

Transient Modeling of a Coaxial Cable
Introduction
Time-domain simulations of Maxwell’s equations are useful for
This example considers a pulse propagating down a coaxial transmission line for three different termination types: short, open, and matched. The signal propagation time is deduced from the reflected waves detected at the input port.
Model Definition
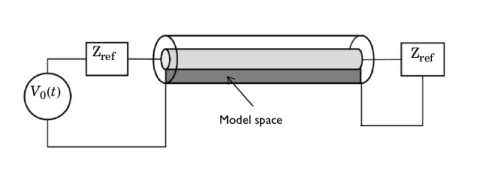
The model setup, schematically shown in Figure 1, is a short section of an air-filled coaxial transmission line. The symmetry of the structure allows for a 2D axisymmetric model geometry.
Figure 1: Schematic of a section of a coaxial transmission line connected to a transient voltage source and a load.
At one end of the coaxial cable, or coax for short, a lumped port boundary condition excites the structure; specify a transient excitation pulse, V0(t), by using a Gaussian pulse-windowed sine function. Apply the excitation as a current of magnitude I(t) = V0(t) / Zref flowing tangentially to the excitation boundary. Here Zref refers to the specified characteristic impedance between the voltage generator and the model.
At the other end of the coax, consider, in turn, three different boundary conditions:
1
perfect electric conductor (PEC) — to simulate the short condition;
2
perfect magnetic conductor (PMC) — to simulate an open condition; and
3
lumped port — to simulate a matched load.
On the walls of the coax, apply a PEC boundary condition; this condition is appropriate when both skin depth and losses in the conductors are very small.
Use a triangular mesh with the maximum element size chosen such that there are at least two elements in the radial direction and at least eight elements per wavelength.
The only changes required to the default solver settings are to tighten the relative tolerance from the default value, and to adjust the timespan and output time steps. The internal time steps taken by the solver are auto-selected based on the specified relative tolerance.
Results and Discussion
Figure 2 shows the results of the transient simulation for the three different termination types. The figure plots the radial component of the electric field at the input port as a function of time for the three different termination conditions. The short (PEC) and open (PMC) terminations reflect waves that are 180° out of phase, and the matched load produces almost no reflections. From the reflected waves in the plot, you can read off an approximate signal propagation time through the air-filled transmission line of (0.37 − 0.10) / 2 ns = 0.135 ns. This matches the expected value of Lcoax c, where Lcoax = 40 mm is the length of the line and c is the speed of light in air.
Figure 2: Radial component of electric field at the input port versus time for three different termination conditions: short (blue), open (green), and matched load (red).
Application Library path: RF_Module/Verification_Examples/coaxial_cable_transient
Modeling Instructions
From the File menu, choose New.
New
In the New window, click  Model Wizard.
Model Wizard
1
In the Model Wizard window, click  2D Axisymmetric.
2
In the Select Physics tree, select Radio Frequency>Electromagnetic Waves, Transient (temw).
3
Click Add.
4
Click  Study.
5
In the Select Study tree, select General Studies>Time Dependent.
6
Global Definitions
Parameters 1
1
In the Model Builder window, under Global Definitions click Parameters 1.
2
In the Settings window for Parameters, locate the Parameters section.
3
Next, define the excitation, V0(t), in terms of a Gaussian pulse and a sine function.
Define a Gaussian pulse.
Gaussian Pulse 1 (gp1)
1
In the Home toolbar, click  Functions and choose Global>Gaussian Pulse.
2
In the Settings window for Gaussian Pulse, type gauss_pulse in the Function name text field.
3
Locate the Parameters section. In the Location text field, type 2*T.
4
In the Standard deviation text field, type T/2.
Now use this pulse in an analytic function for V0(t):
Analytic 1 (an1)
1
In the Home toolbar, click  Functions and choose Global>Analytic.
2
In the Settings window for Analytic, type V0 in the Function name text field.
3
Locate the Definition section. In the Expression text field, type gauss_pulse(t)*sin(2*pi*f*t).
4
In the Arguments text field, type t.
5
Locate the Units section. In the Arguments text field, type s.
6
In the Function text field, type V.
To plot the function, you need to specify a suitable time interval.
7
Locate the Plot Parameters section. In the table, enter the following settings:
8
Click to collapse the Plot Parameters section. Click  Plot.
Geometry 1
An elongated rectangle offset from the symmetry axis represents the straight coaxial cable.
Rectangle 1 (r1)
1
In the Geometry toolbar, click  Rectangle.
2
In the Settings window for Rectangle, locate the Size and Shape section.
3
In the Width text field, type R_coax-r_coax.
4
In the Height text field, type L_coax.
5
Locate the Position section. In the r text field, type r_coax.
6
Click  Build All Objects.
Definitions
Set up a point probe for plotting the electric field component Er while solving. You will also use this plot to reproduce Figure 2.
Domain Point Probe 1
1
In the Definitions toolbar, click  Probes and choose Domain Point Probe.
2
In the Settings window for Domain Point Probe, locate the Point Selection section.
3
In row Coordinates, set r to r_coax.
4
Select the Snap to closest boundary check box.
Point Probe Expression 1 (ppb1)
1
In the Model Builder window, expand the Domain Point Probe 1 node, then click Point Probe Expression 1 (ppb1).
2
In the Settings window for Point Probe Expression, click Replace Expression in the upper-right corner of the Expression section. From the menu, choose Component 1 (comp1)>Electromagnetic Waves, Transient>Electric>Electric field - V/m>temw.Er - Electric field, r component.
Electromagnetic Waves, Transient (temw)
Now set up the physics. Begin by defining the Lumped port input condition.
Lumped Port 1
1
In the Model Builder window, under Component 1 (comp1) right-click Electromagnetic Waves, Transient (temw) and choose Lumped Port.
2
For the first port, wave excitation is on by default.
3
In the Settings window for Lumped Port, locate the Lumped Port Properties section.
4
In the V0 text field, type V0(t).
5
Locate the Settings section. In the Zref text field, type (Z0_const/2/pi)*log(R_coax/r_coax).
The open case uses a PMC condition at the termination.
Perfect Magnetic Conductor 1
1
In the Physics toolbar, click  Boundaries and choose Perfect Magnetic Conductor.
2
Finally, define a lumped port condition to use for the matched load case.
Lumped Port 2
1
In the Physics toolbar, click  Boundaries and choose Lumped Port.
2
3
In the Settings window for Lumped Port, locate the Settings section.
4
In the Zref text field, type (Z0_const/2/pi)*log(R_coax/r_coax).
Add Material
1
In the Home toolbar, click  Add Material to open the Add Material window.
2
Go to the Add Material window.
3
4
Click Add to Component in the window toolbar.
5
In the Home toolbar, click  Add Material to close the Add Material window.
Mesh 1
Free Triangular 1
In the Mesh toolbar, click  Free Triangular.
Size
1
In the Model Builder window, click Size.
2
In the Settings window for Size, locate the Element Size section.
3
Click the Custom button.
4
Locate the Element Size Parameters section. In the Maximum element size text field, type h_max.
5
Click  Build All.
Study 1
Step 1: Time Dependent
1
In the Model Builder window, under Study 1 click Step 1: Time Dependent.
2
In the Settings window for Time Dependent, locate the Study Settings section.
3
In the Output times text field, type range(0,T/24,10*T).
4
From the Tolerance list, choose User controlled.
5
In the Relative tolerance text field, type 0.0001.
To study the short termination case first, disable the PMC and lumped port conditions so that the default PEC condition is activated on the termination boundary.
6
Locate the Physics and Variables Selection section. Select the Modify model configuration for study step check box, disable Perfect Magnetic Conductor 1 and Lumped Port 2.
7
In the Home toolbar, click  Compute.
Results
2D Plot Group 1
Click on the Probe Plot 1 tab to place it in focus.
Probe Plot Group 2
1
In the Model Builder window, click Probe Plot Group 2.
2
In the Settings window for 1D Plot Group, locate the Legend section.
3
From the Position list, choose Lower right.
When the solver finishes the plot should look like that in the figure below.
2D Plot Group 1
The default surface plot shows the electric field in the coax at the end of the simulation interval. Because the transient has died out, the solution you see is only noise. Modify the time to get a more interesting plot.
1
In the Model Builder window, click 2D Plot Group 1.
2
In the Settings window for 2D Plot Group, locate the Data section.
3
From the Time (s) list, choose 1.5E-10.
4
In the 2D Plot Group 1 toolbar, click  Plot.
Now turn to the open termination case.
Definitions
Point Probe Expression 1 (ppb1)
1
In the Model Builder window, under Component 1 (comp1)>Definitions>Domain Point Probe 1 click Point Probe Expression 1 (ppb1).
2
In the Settings window for Point Probe Expression, click to expand the Table and Window Settings section.
3
From the Output table list, choose New table.
With these settings you get a plot for the short and open termination cases in the same plot window.
Electromagnetic Waves, Transient (temw)
Perfect Magnetic Conductor 1
In the Model Builder window, under Component 1 (comp1)>Electromagnetic Waves, Transient (temw) right-click Perfect Magnetic Conductor 1 and choose Enable.
Study 1
1
In the Model Builder window, click Study 1.
2
In the Settings window for Study, locate the Study Settings section.
3
Clear the Generate default plots check box.
4
In the Home toolbar, click  Compute.
Results
Probe Plot Group 2
The reflected waves for the short and open terminations are 180 degrees out of phase.
Finally, activate the matched load case.
Definitions
Point Probe Expression 1 (ppb1)
1
In the Model Builder window, under Component 1 (comp1)>Definitions>Domain Point Probe 1 click Point Probe Expression 1 (ppb1).
2
In the Settings window for Point Probe Expression, locate the Table and Window Settings section.
3
From the Output table list, choose New table.
Electromagnetic Waves, Transient (temw)
Lumped Port 2
1
In the Model Builder window, under Component 1 (comp1)>Electromagnetic Waves, Transient (temw) right-click Lumped Port 2 and choose Enable.
Note that you do not need to disable the PMC condition because it is overridden by the lumped port.
Study 1
In the Home toolbar, click  Compute.
Results
Probe Plot Group 2
1
In the Model Builder window, under Results click Probe Plot Group 2.
2
In the Settings window for 1D Plot Group, locate the Plot Settings section.
3
Select the x-axis label check box.
4
5
Select the y-axis label check box.
6
In the associated text field, type Electric field, r component (V/m).
7
In the Probe Plot Group 2 toolbar, click  Plot.
Probe Table Graph 1
1
In the Model Builder window, expand the Probe Plot Group 2 node, then click Probe Table Graph 1.
2
In the Settings window for Table Graph, click to expand the Legends section.
3
From the Legends list, choose Manual.
4
Probe Table Graph 2
1
In the Model Builder window, click Probe Table Graph 2.
2
In the Settings window for Table Graph, locate the Legends section.
3
From the Legends list, choose Manual.
4
Probe Table Graph 3
1
In the Model Builder window, click Probe Table Graph 3.
2
In the Settings window for Table Graph, locate the Legends section.
3
From the Legends list, choose Manual.
4
The plot should now look like that in Figure 2, with the red graph corresponding to the matched case.