PDF

Ion Energy Distribution Function
Introduction
One of the most useful quantities of interest after solving a self-consistent plasma model is the ion energy distribution function (IEDF). The magnitude and shape of the IEDF depends on many of the discharge parameters; pressure, plasma potential, sheath width and so forth. At very low pressures the plasma sheath is said to be collisionless, meaning that the ion energy is not retarded by collisions with the background gas. At higher pressures the ions collide with the background gas molecules in the sheath and their energy at the moment of impact with a surface is reduced.
Note: This application requires the Plasma Module, Particle Tracing Module, and AC/DC Module.
Model Definition
The equations of motion for ions in an electric field and background gas are
where m is the ion mass (SI unit: kg), v is the particle velocity (SI unit: m/s), q is unit charge (SI unit: C), and Z is the ion charge number (SI unit: dimensionless).
When an ion undergoes a collision with the background gas, its velocity vector changes. The probability of a collision event occurring depends in the ion-neutral collision frequency, ν (SI unit: 1/s), which is defined as:
where Nd is the background number density (SI unit: 1/m3), σ is the ion-neutral charge exchange collision cross section (SI unit: m2), vp is the particle velocity, and vg is the velocity of the background gas atoms or molecules. In this example the collision cross section is assumed to be constant, 6x10-19m2, as given in Ref. 2.
The collision probability defined as:
If P is greater than a random number between 0 and 1 then the particle velocity is reinitialized to the following expression:
where vp is the precollision particle velocity, mg is the mass of the background gas atoms or molecules, R is a uniformly distributed random unit vector, and vg is the velocity of the background gas atoms or molecules, which is sampled from a Maxwellian distribution function:
where T is the temperature of the background gas.
The particles are released 5 mm away from the wafer surface and 20 mm radially inward from the center of the reactor. There are 22,500 ions modeled. They all start at the same point in space and have an initial Maxwellian distribution function, which is for each velocity direction
where T is the initial temperature of the ions, in this case 400 K. This results in a distribution function of
When the ions strike the wafer their velocity is frozen for all subsequent time steps. This allows the velocity and energy distribution function to be recovered once all the ions have made contact with the wall.
The angle at which the ions strike the wafer is also of interest. This can be recovered by plotting a histogram of the inverse tangent of the radial and axial particle velocities.
Results and Discussion
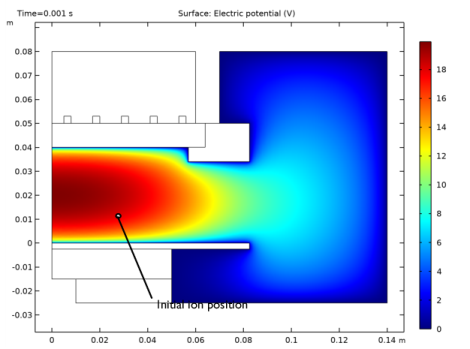
The electric potential for an argon plasma at an operating pressure of 20 mTorr is plotted in Figure 1. The initial starting position for the ions is also shown:
Figure 1: Plot of the plasma potential used to compute the IEDF.
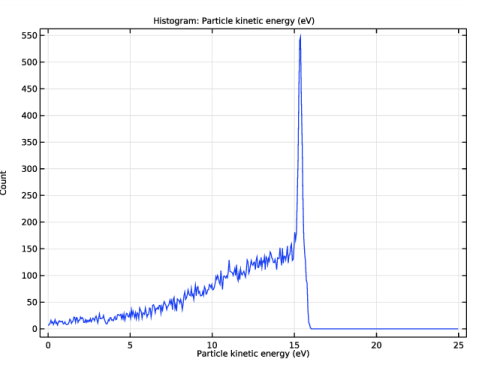
The IEDF is plotted in Figure 2. Most of the ions have kinetic energy between around 20 and 22 eV. At the initial starting coordinate, the plasma potential is 20.98 V, so it is expected that the kinetic energy of the ions at the wall is of similar order. As the pressure decreases the collision frequency between ions and neutrals is reduced, so the IEDF should shift to the right, toward the maximum value given by the plasma potential. As the pressure increases the sheath becomes more collisional which inhibits the ions from reaching higher energies. Of course, changing the pressure results in a change in the discharge characteristics which may alter the shape and magnitude of the IEDF in a nonlinear way.
Figure 2: Plot of the ion energy distribution function (IEDF) in an inductively coupled plasma.
The angle at which the ions are striking the wafer surface are plotted in Figure 3. Due to the fact that the ions are released relatively close to the wafer surface, the range of angles is small, typically between -20 and 20 degrees. The plot is not quite symmetric due to the presence of a small outward component of the ambipolar electric field.
Figure 3: Plot of the angle at which the ions strike the surface of the wafer.
The ion angular energy distribution function is plotted in Figure 4. The angle is not quite symmetric about zero due to the profile of the electric field at the release point.
Figure 4: Plot of the ion angular energy distribution function.
Notes About the COMSOL Implementation
This model is most conveniently solved by opening an existing model in the Plasma Module Application Library, then computing the ion trajectories.
References
1. O.V. Vozniy, G.Y. Yeom, and A. Yu. Kropotov, “Plasma Potential Influence on Ion Energy Distribution Function in ICP Source”, PSE, vol 5, no 1-2, pp. 28–33, http://www.pse.scpt.org.ua/en/jornal/1-2_07/3.pdf.
2. M. Surendra, “Radiofrequency Discharge Benchmark Model Comparison”, Plasma Sources Sci. Technol, vol. 4, pp 56–73, 1995.
3. A. V. Phelps, “The application of scattering cross sections to ion flux models in discharge sheaths”, J. Appl. Phys. vol. 76, pp. 747–753, 1994.
Application Library path: Plasma_Module/Inductively_Coupled_Plasmas/ion_energy_distribution_function
Modeling Instructions
Start by opening the model of the inductively coupled GEC reference cell from the Plasma Module Application Library.
From the File menu, choose Open.
Browse to the model’s Application Libraries folder and double-click the file argon_gec_icp.mph.
Component 1 (comp1)
Now add a Charged Particle Tracing interface to compute the ion energy distribution function.
1
From the Home menu, choose Add Physics.
Add Physics
1
Go to the Add Physics window.
2
In the tree, select AC/DC>Particle Tracing>Charged Particle Tracing (cpt).
3
Click Add to Component 1 in the window toolbar.
4
From the Home menu, choose Add Physics.
Root
From the Home menu, choose Add Study.
Add Study
1
Go to the Add Study window.
2
Find the Physics interfaces in study subsection. In the table, clear the Solve check boxes for Plasma (plas) and Magnetic Fields (mf).
3
Find the Studies subsection. In the Select Study tree, select General Studies>Time Dependent.
4
Click Add Study in the window toolbar.
5
From the Home menu, choose Add Study.
Charged Particle Tracing (cpt)
1
In the Model Builder window, expand the Component 1 (comp1) node, then click Charged Particle Tracing (cpt).
2
In the Settings window for Charged Particle Tracing, locate the Domain Selection section.
3
Click  Clear Selection.
4
Global Definitions
Parameters 1
1
In the Model Builder window, under Global Definitions click Parameters 1.
2
In the Settings window for Parameters, locate the Parameters section.
3
Definitions
Analytic 1 (an1)
1
In the Home toolbar, click  Functions and choose Global>Analytic.
Enter the analytic approximation for momentum cross section for elastic scattering between Ar+ ions and neutral Ar atoms, which depends on the kinetic energy of the particles.
2
In the Settings window for Analytic, type Qm in the Function name text field.
3
Locate the Definition section. In the Expression text field, type 1.15e-18*x^(-0.1)*(1+0.015/x)^0.6.
4
Locate the Units section. In the Arguments text field, type eV.
5
In the Function text field, type m^2.
Analytic 2 (an2)
1
In the Home toolbar, click  Functions and choose Global>Analytic.
Enter the analytic approximation for isotropic elastic collision between Ar+ ions and neutral Ar atoms from, which depends on the kinetic energy of the particles.
2
In the Settings window for Analytic, type Qi in the Function name text field.
3
Locate the Definition section. In the Expression text field, type 2e-19/(x^(0.5)*(1+x))+3e-19*x/(1+x/3)^(2.3).
4
Locate the Units section. In the Arguments text field, type eV.
5
In the Function text field, type m^2.
Charged Particle Tracing (cpt)
Particle Properties 1
1
In the Model Builder window, under Component 1 (comp1)>Charged Particle Tracing (cpt) click Particle Properties 1.
2
In the Settings window for Particle Properties, locate the Particle Mass section.
3
In the mp text field, type mi.
4
Locate the Charge Number section. In the Z text field, type 1.
Now add an Electric Force feature. The electric potential comes from the solved plasma model. Specify that piecewise polynomial recovery should be used when computing the electric force. This results in a more accurate reconstruction of the electric field.
Electric Force 1
1
In the Physics toolbar, click  Domains and choose Electric Force.
2
3
In the Settings window for Electric Force, locate the Electric Force section.
4
From the Specify force using list, choose Electric potential.
5
From the V list, choose Electric potential (plas).
6
Locate the Advanced Settings section. Select the Use piecewise polynomial recovery on field check box.
Now you add the collisional force between the ions and background gas. The collision frequency is a function of the neutral number density (plas.Nn), the elastic and charge exchange cross section and the particle velocity (cpt.V).
Collisions 1
1
In the Physics toolbar, click  Domains and choose Collisions.
2
3
In the Settings window for Collisions, locate the Fluid Properties section.
4
In the Nd text field, type plas.Nn.
5
In the Mg text field, type Mw.
6
In the T text field, type plas.T.
Elastic 1
1
In the Physics toolbar, click  Attributes and choose Elastic.
2
In the Settings window for Elastic, locate the Collision Frequency section.
3
In the σ text field, type Qi(cpt.Ep).
Collisions 1
In the Model Builder window, click Collisions 1.
Resonant Charge Exchange 1
1
In the Physics toolbar, click  Attributes and choose Resonant Charge Exchange.
2
In the Settings window for Resonant Charge Exchange, locate the Collision Frequency section.
3
In the σ text field, type (Qm(cpt.Ep)-Qi(cpt.Ep))/2.
Release from Grid 1
1
In the Physics toolbar, click  Global and choose Release from Grid.
2
In the Settings window for Release from Grid, locate the Initial Coordinates section.
3
In the qr,0 text field, type 0.02.
4
In the qz,0 text field, type 0.005.
5
Locate the Initial Velocity section. From the Initial velocity list, choose Maxwellian.
6
In the Nv text field, type 150.
7
In the T0 text field, type 400.
Study 2
Step 1: Time Dependent
1
In the Model Builder window, under Study 2 click Step 1: Time Dependent.
2
In the Settings window for Time Dependent, locate the Study Settings section.
3
In the Output times text field, type range(0,5.0e-6/30,5.0e-6).
4
Click to expand the Values of Dependent Variables section. Find the Values of variables not solved for subsection. From the Settings list, choose User controlled.
5
From the Method list, choose Solution.
6
From the Study list, choose Study 1, Frequency-Transient.
7
In the Home toolbar, click  Compute.
Results
Ion Energy Distribution Function
1
In the Home toolbar, click  Add Plot Group and choose 1D Plot Group.
2
In the Settings window for 1D Plot Group, type Ion Energy Distribution Function in the Label text field.
3
Locate the Data section. From the Dataset list, choose Particle 1.
4
From the Time selection list, choose Last.
Histogram 1
1
Right-click Ion Energy Distribution Function and choose Histogram.
2
In the Settings window for Histogram, click Replace Expression in the upper-right corner of the Expression section. From the menu, choose Component 1 (comp1)>Charged Particle Tracing>Velocity and energy>cpt.Ep - Particle kinetic energy - J.
3
Locate the Expression section. From the Unit list, choose eV.
4
Locate the Bins section. From the Entry method list, choose Limits.
5
In the Limits text field, type range(0,25/500,25).
6
In the Ion Energy Distribution Function toolbar, click  Plot.
Ion Angular Distribution Function
1
In the Home toolbar, click  Add Plot Group and choose 1D Plot Group.
2
In the Settings window for 1D Plot Group, type Ion Angular Distribution Function in the Label text field.
3
Locate the Data section. From the Dataset list, choose Particle 1.
4
From the Time selection list, choose Last.
Histogram 1
1
Right-click Ion Angular Distribution Function and choose Histogram.
2
In the Settings window for Histogram, locate the Expression section.
3
In the Expression text field, type atan(cpt.vr/cpt.vz).
4
Locate the Bins section. In the Number text field, type 500.
5
Locate the Expression section. From the Unit list, choose °.
6
In the Ion Angular Distribution Function toolbar, click  Plot.
Ion Angular Distribution Function
1
In the Model Builder window, click Ion Angular Distribution Function.
2
In the Settings window for 1D Plot Group, locate the Plot Settings section.
3
Select the x-axis label check box.
4
In the associated text field, type Ion angle of incidence (deg).
5
In the Ion Angular Distribution Function toolbar, click  Plot.
Ion Angular Energy Distribution Function
1
In the Home toolbar, click  Add Plot Group and choose 2D Plot Group.
2
In the Settings window for 2D Plot Group, type Ion Angular Energy Distribution Function in the Label text field.
3
Locate the Data section. From the Dataset list, choose Particle 1.
4
From the Time (s) list, choose 5E-6.
Histogram 1
1
In the Ion Angular Energy Distribution Function toolbar, click  More Plots and choose Histogram.
2
In the Settings window for Histogram, locate the x-Expression section.
3
In the Expression text field, type atan(cpt.vr/cpt.vz).
4
From the Unit list, choose °.
5
Select the Description check box.
6
In the associated text field, type Angle of incidence (deg).
7
Locate the y-Expression section. In the Expression text field, type cpt.Ep.
8
From the Unit list, choose eV.
9
Locate the Bins section. Find the x bins subsection. From the Entry method list, choose Limits.
10
In the Limits text field, type range(-10,20/79,10).
11
Find the y bins subsection. From the Entry method list, choose Limits.
12
In the Limits text field, type range(0,22/79,22).
Ion Angular Energy Distribution Function
1
In the Model Builder window, click Ion Angular Energy Distribution Function.
2
In the Ion Angular Energy Distribution Function toolbar, click  Plot.
3
Click the  Zoom Extents button in the Graphics toolbar.