|
|
Te
|
|
|
Vs
|
|
|
Vpp
|
|
|
τi
|


|
•
|
A Time Periodic study that computes the periodic steady-state solution of the plasma.
|
|
•
|
A Time Periodic to Time Dependent study that converts the periodic steady-state solution to the time domain.
|
|
•
|
A Time Dependent study that is used to compute the ion trajectories through the sheath.
|
|
1
|
In the Model Wizard window, Select the Plasma, Time Periodic (ptp) interface and the Time Periodic study to compute the periodic steady state solution of the plasma.
|
|
2
|
|
3
|
|
4
|
Click Add.
|
|
5
|
Click
|
|
6
|
|
7
|
Click
|
|
1
|
|
2
|
|
3
|
|
1
|
|
2
|
|
1
|
|
2
|
|
3
|
|
4
|
|
1
|
|
2
|
|
3
|
|
4
|
|
5
|
|
6
|
|
1
|
|
2
|
Click in the Graphics window and then press Ctrl+A to select both objects.
|
|
3
|
|
4
|
|
5
|
|
1
|
|
2
|
On the object uni1, select Point 4 only.
|
|
3
|
|
4
|
|
1
|
|
2
|
On the object cha1, select Points 3 and 5 only.
|
|
3
|
|
4
|
|
1
|
|
2
|
|
3
|
|
4
|
|
1
|
|
2
|
On the object fil1, select Point 3 only.
|
|
3
|
|
4
|
|
5
|
On the object pt1, select Point 1 only.
|
|
6
|
|
1
|
|
2
|
On the object fin, select Boundary 4 only.
|
|
3
|
|
1
|
|
2
|
|
3
|
|
4
|
|
5
|
|
1
|
|
2
|
|
3
|
Click Browse.
|
|
1
|
|
2
|
|
3
|
|
4
|
|
1
|
|
2
|
|
3
|
|
4
|
|
1
|
|
2
|
|
3
|
|
4
|
|
1
|
|
2
|
|
3
|
|
1
|
|
2
|
|
3
|
|
4
|
|
5
|
Click to expand the Mobility and Diffusivity Expressions section. From the Specification list, choose Specify mobility, compute diffusivity.
|
|
6
|
|
7
|
Click to expand the Mobility Specification section. From the Specify using list, choose Argon ion in argon.
|
|
1
|
|
2
|
|
3
|
|
4
|
|
1
|
|
2
|
|
3
|
|
5
|
|
6
|
|
1
|
In the Model Builder window, under Component 1 (comp1)>Plasma, Time Periodic (ptp) right-click 1: Ar+=>Ar and choose Duplicate.
|
|
2
|
|
3
|
|
4
|
|
1
|
In the Model Builder window, under Component 1 (comp1)>Plasma, Time Periodic (ptp) right-click 2: Ar+=>Ar and choose Duplicate.
|
|
2
|
|
3
|
|
4
|
|
1
|
|
2
|
|
3
|
|
4
|
|
1
|
|
2
|
|
3
|
|
1
|
|
1
|
|
1
|
|
2
|
|
3
|
|
4
|
|
5
|
|
1
|
|
1
|
|
2
|
|
3
|
|
4
|
|
5
|
|
6
|
|
1
|
|
1
|
|
2
|
|
3
|
|
1
|
|
2
|
|
3
|
|
5
|
|
1
|
|
2
|
|
3
|
|
1
|
|
2
|
|
3
|
|
1
|
|
2
|
|
3
|
|
4
|
Click to expand the Corner Settings section. From the Handling of sharp corners list, choose Trimming.
|
|
1
|
|
2
|
|
3
|
|
5
|
|
6
|
|
7
|
|
1
|
|
2
|
|
3
|
|
4
|
Click
|
|
1
|
In the Model Builder window, expand the Study 1>Solver Configurations>Solution 1 (sol1)>Stationary Solver 1 node, then click Fully Coupled 1.
|
|
2
|
|
3
|
|
4
|
|
5
|
|
6
|
|
7
|
|
8
|
|
9
|
|
10
|
|
1
|
|
2
|
|
3
|
Find the Studies subsection. In the Select Study tree, select Preset Studies for Selected Physics Interfaces>Time Periodic to Time Dependent.
|
|
4
|
|
5
|
|
1
|
|
2
|
Click
|
|
3
|
|
4
|
|
5
|
Click Replace.
|
|
6
|
In the Settings window for Time Periodic to Time Dependent, click to expand the Values of Dependent Variables section.
|
|
7
|
Find the Values of variables not solved for subsection. From the Settings list, choose User controlled.
|
|
8
|
|
9
|
|
10
|
|
11
|
|
1
|
|
2
|
|
3
|
|
4
|
Find the Physics interfaces in study subsection. In the table, clear the Solve check boxes for Study 1 and Study 2.
|
|
5
|
|
6
|
|
1
|
|
2
|
|
3
|
|
4
|
|
5
|
|
6
|
|
1
|
|
2
|
|
3
|
|
4
|
|
5
|
|
6
|
|
1
|
|
2
|
|
1
|
In the Model Builder window, under Component 1 (comp1)>Charged Particle Tracing (cpt) click Particle Properties 1.
|
|
2
|
|
3
|
|
4
|
|
1
|
|
3
|
|
4
|
|
5
|
|
6
|
|
7
|
|
1
|
|
2
|
|
3
|
|
4
|
|
1
|
|
2
|
|
3
|
|
4
|
|
1
|
|
2
|
|
3
|
|
1
|
|
2
|
|
3
|
Click
|
|
4
|
|
5
|
|
6
|
|
7
|
Click Replace.
|
|
8
|
|
9
|
|
10
|
|
11
|
|
12
|
|
13
|
|
14
|
|
1
|
|
2
|
|
3
|
Find the Physics interfaces in study subsection. In the table, clear the Solve check box for Plasma, Time Periodic (ptp).
|
|
4
|
|
5
|
|
6
|
|
1
|
|
2
|
Click
|
|
3
|
In the Range dialog box, The study should run for a number of periods that allows for all released ions to reach the surface.
|
|
4
|
|
5
|
|
6
|
Click Replace.
|
|
7
|
In the Settings window for Time Dependent, click to expand the Values of Dependent Variables section.
|
|
8
|
Find the Values of variables not solved for subsection. From the Settings list, choose User controlled.
|
|
9
|
|
10
|
|
1
|
|
2
|
|
3
|
|
4
|
|
5
|
|
6
|
|
1
|
|
2
|
In the Settings window for 1D Plot Group, type Ion Energy Distribution Function (IEDF) in the Label text field.
|
|
3
|
|
4
|
|
1
|
|
2
|
|
3
|
|
4
|
|
5
|
|
6
|
Click
|
|
7
|
|
8
|
|
9
|
|
10
|
Click Replace.
|
|
11
|
|
1
|
|
2
|
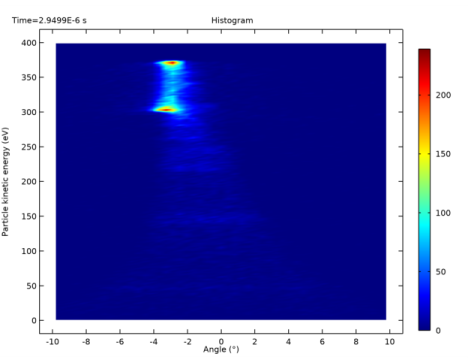
In the Settings window for 2D Plot Group, type Ion Angular Energy Distribution Function (IAEDF) in the Label text field.
|
|
3
|
|
4
|
|
1
|
In the Ion Angular Energy Distribution Function (IAEDF) toolbar, click
|
|
2
|
|
3
|
|
4
|
|
5
|
Select the Description check box.
|
|
6
|
|
7
|
|
8
|
|
9
|
|
10
|
Click
|
|
11
|
|
12
|
|
13
|
|
14
|
|
15
|
Click Replace.
|
|
16
|
|
17
|
|
18
|
Click
|
|
19
|
|
20
|
|
21
|
|
22
|
Click Replace.
|
|
23
|
|
24
|
|
1
|
|
2
|
In the Settings window for Global Evaluation, click Replace Expression in the upper-right corner of the Expressions section. From the menu, choose Component 1 (comp1)>Plasma, Time Periodic>Metal Contact 1>ptp.mct1.Va_per - Voltage amplitude - V.
|
|
3
|
Click Add Expression in the upper-right corner of the Expressions section. From the menu, choose Component 1 (comp1)>Plasma, Time Periodic>Metal Contact 1>ptp.mct1.Vdcb_per - DC bias voltage - V.
|
|
4
|
Click
|