PDF

Cooling of an Injection Mold
Introduction
Cooling is an important process in the production of injection molded plastics. First of all, the cooling time may well represent more than half of the production cycle time. Second, a homogeneous cooling process is desired to avoid defects in the manufactured parts. If plastic materials in the injection molding die are cooled down uniformly and slowly, residual stresses can be avoided, and thereby the risk of warps and cracks in the end product can be minimized.
As a consequence, the positioning and properties of the cooling channels become important aspects when designing the mold.
The simulation of heat transfer in molds of relatively complex geometries requires a 3D representation. Simulation of 3D flow and heat transfer inside the cooling channels are computationally expensive. An efficient short-cut alternative is to model the flow and heat transfer in the cooling channels with 1D pipe flow equations, and still model the surrounding mold and product in 3D.
This example shows how you can use the Nonisothermal Pipe Flow interface together with the Heat Transfer in Solids interface to model a mold cooling process. The equations describing the cooling channels are fully coupled to the heat transfer equations of the mold and the polyurethane part.
Figure 1: The steering wheel of a car, made from polyurethane.
Model Definition
Model Geometry and Process conditions
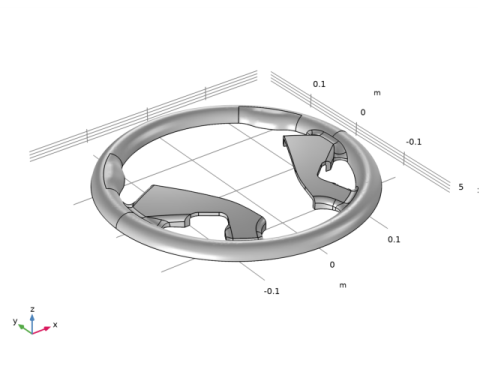
The polyurethane material used for a steering wheel is produced by several different molds. The part considered in this model is the top half of the wheel grip, shown in gray in Figure 2.
Figure 2: Polyurethane parts for a steering wheel. The top half of the grip is modeled in this example.
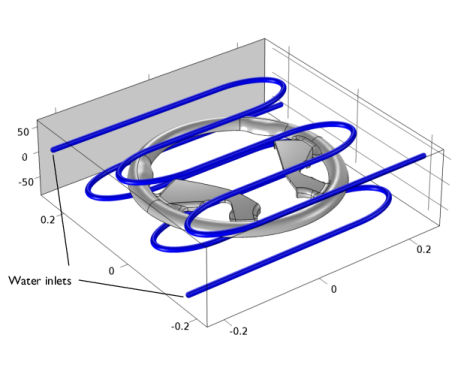
The mold consists of a 50-by-50-by-15 cm steel block. Two cooling channels, 1 cm in diameter, are machined into the block as illustrated in Figure 3.
Figure 3: Mold block and cooling channels.
The after injection of the polyurethane, the average temperature of the mold a the plastic material is 473 K. Water at room temperature is used as cooling fluid and flows through the channels at a rate of 10 liters/min. The model simulates a 10 min cooling process.
For numerical stability reasons, the model is set up with an initial water temperature of 473 K, which is ramped down to 288 K during the first few seconds.
Pipe Flow Equations
The momentum and mass conservation equations below describe the flow in the cooling channels:
(1)
Above, u is the cross section averaged fluid velocity (m/s) along the tangent of the centerline of a pipe. A (m2) is the cross section area of the pipe, ρ (kg/m3) is the density, and p (N/m2) is the pressure. For more information, refer to the section Theory for the Pipe Flow Interface in the Pipe Flow Module User’s Guide.
Expressions for the Darcy Friction Factor
The second term on the right-hand side of Equation 1 accounts for pressure drop due to viscous shear. The Pipe Flow physics uses the Churchill friction model (Ref. 1) to calculate fD. It is valid for laminar flow, turbulent flow, and the transitional region in between. The Churchill friction model is predefined in the Nonisothermal Pipe Flow interface and is given by:
where
As seen from the equations above, the friction factor depends on the surface roughness divided by diameter of the pipe, e/d. Surface roughness values can be selected from a list in the Pipe Properties feature or be entered as user-defined values.
In the Churchill equation, fD is also a function of the fluid properties, flow velocity and geometry, through the Reynolds number:
The physical properties of water as function of temperature are directly available from the software’s built-in material library.
Heat Transfer Equations
Cooling Channels
The energy equation for the cooling water inside the pipe is:
(2)
where Cp (J/(kg·K)) is the heat capacity at constant pressure, T is the cooling water temperature (K), and k (W/(m·K)) is the thermal conductivity. The second term on the right-hand side corresponds to heat dissipated due to internal friction in the fluid. It is negligible for the short channels considered here. Qwall (W/m) is a source term that accounts for the heat exchange with the surrounding mold block.
Mold Block and Polyurethane Part
Heat transfer in the solid steel mold block as well as the molded polyurethane part is governed by conduction:
(3)
Above, T2 is the temperature in the solids. The source term Qwall comes into play for the heat balance in Equation 3 through a line heat source where the pipe is situated. This coupling is automatically done by the Wall Heat Transfer feature in the Nonisothermal Pipe Flow interface.
Heat Exchange
The heat exchange term Qwall (W/m) couple the two energy balances given by Equation 2 and Equation 3:
The heat transfer through the pipe wall is given by
(4)
In Equation 4 Z (m) is the perimeter of the pipe, h (W/(m2·K)) a heat transfer coefficient and Text (K) the external temperature outside of the pipe. Qwall appears as a source term in the pipe heat transfer equation.
The Wall heat transfer feature requires the external temperature and at least an internal film resistance.
Text can be a constant, parameter, expression, or given by a temperature field computed by another physics interface, typically a 3D Heat Transfer interface. h is automatically calculated through film resistances and wall layers that are added as subnodes. For details, refer to the Theory for the Heat Transfer in Pipes Interface in the Pipe Flow Module User’s Guide.
In this model example, Text is given as the temperature field computed by a 3D heat transfer interface, and automatic heat transfer coupling is done to the 3D physics side as a line source. The temperature coupling between the pipe and the surrounding domain is implemented as a line heat source in the 3D domain. The source strength is proportional to the temperature difference between the pipe fluid and the surrounding domain.
The Wall Heat Transfer feature is added to the Nonisothermal Pipe Flow interface, and the External temperature is set to the temperature of the Heat Transfer in solids interface.
Figure 4: In the Wall Heat Transfer feature, set the External temperature to the temperature field computed by the Heat Transfer in Solids interface.
The heat transfer coefficient, h, depends on the physical properties of water and the nature of the flow and is calculated from the Nusselt number:
where k is the thermal conductivity of the material, and Nu is the Nusselt number. dh is the hydraulic diameter of the pipe.
COMSOL detects if the flow is laminar or turbulent. For the laminar flow regime, an analytic solution is available that gives Nu = 3.66 for circular tubes (Ref. 2). For turbulent flow inside channels of circular cross sections the following Nusselt correlation is used (Ref. 3):
(5)
where Pr is the Prandtl number:
Note that Equation 5 is a function of the friction factor, fD, and therefore that the radial heat transfer increases with the surface roughness of the channels.
Note: All the correlations discussed above are automatically used by the Wall Heat Transfer feature in the Pipe Flow Module, and it detects if the flow is laminar or turbulent for automatic selection of the correct correlation.
Results and Discussion
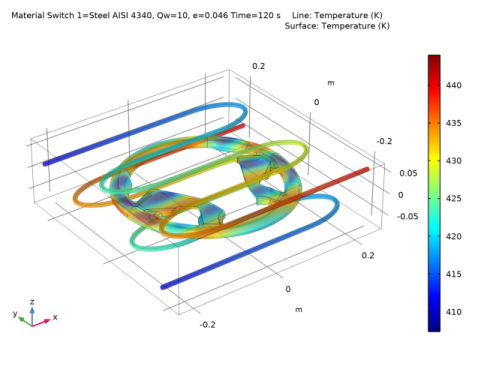
The mold and polyurethane part, initially at 473 K, are cooled for 10 minutes by water at room temperature. Figures below show sample results when flow rate of the cooling water is 10 liters/minute and the surface roughness of the channels is 46 μm. After two minutes of cooling, the hottest and coldest parts of the polyurethane part differ by approximately 40 K (Figure 5).
Figure 5: Temperature distribution in the polyurethane part and the cooling channels after 2 minutes of cooling.
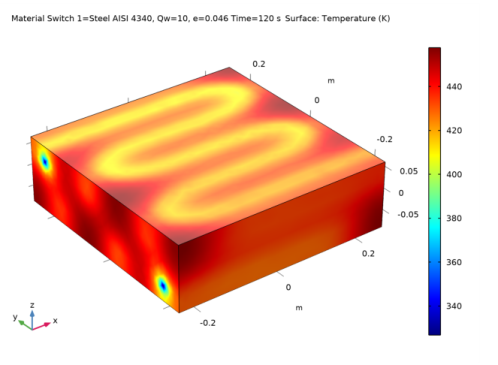
Figure 6 shows the temperature distribution in the steel mold after 2 minutes. The temperature footprint of the cooling channels is clearly visible.
Figure 6: Temperature distribution in the steel mold block after 2 minutes of cooling.
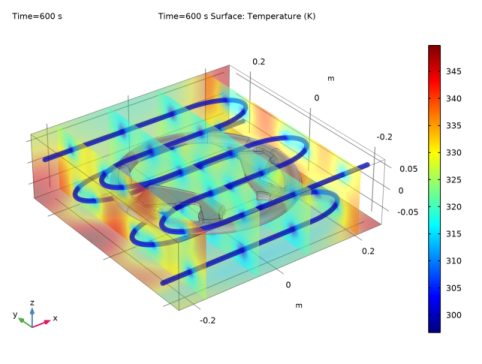
After 10 minutes of cooling, the temperature in the mold block is more uniform, with a temperature at the center of approximately 333 K (Figure 7). Still, the faces with cooling channel inlets and outlets are more than 20 K hotter.
Figure 7: Temperature distribution in the steel mold block after 10 minutes of cooling.
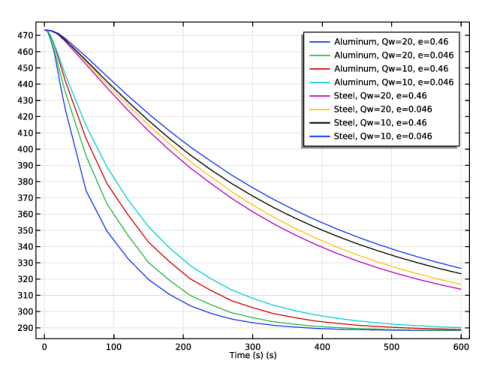
To evaluate the influence of factors affecting the cooling time, use Material and Parametric sweeps. Figure 8 shows the average temperature of the polyurethane part as function of the cooling time for the several flow rates of the cooling water, the surface roughness of the cooling channels, and the mold materials.
Figure 8: Average temperature of the polyurethane part as function of time and cooling conditions.
References
1. S.W. Churchill, “Friction factor equations span all fluid-flow regimes,” Chem. Eng., vol. 84, no. 24, p.91, 1997.
2. F.P. Incropera, D.P. DeWitt. Fundamentals of Heat and Mass Transfer, 5th ed., John Wiley & Sons, pp. 486–487, 2002.
3. V. Gnielinski, “New Equation for Heat and Mass Transfer in Turbulent Pipe and Channel Flow,” Int. Chem. Eng. vol. 16, pp. 359–368, 1976.
Application Library path: Pipe_Flow_Module/Heat_Transfer/mold_cooling
Modeling Instructions
From the File menu, choose New.
New
In the New window, click  Model Wizard.
Model Wizard
1
In the Model Wizard window, click  3D.
2
In the Select Physics tree, select Fluid Flow>Nonisothermal Flow>Nonisothermal Pipe Flow (nipfl).
3
Click Add.
4
In the Select Physics tree, select Heat Transfer>Heat Transfer in Solids (ht).
5
Click Add.
6
Click  Study.
7
In the Select Study tree, select General Studies>Time Dependent.
8
Global Definitions
Parameters 1
1
In the Model Builder window, under Global Definitions click Parameters 1.
2
In the Settings window for Parameters, locate the Parameters section.
3
Step 1 (step1)
Create a smooth step function to decrease the coolant temperature at the beginning of the process.
1
In the Home toolbar, click  Functions and choose Global>Step.
2
In the Settings window for Step, locate the Parameters section.
3
In the Location text field, type 2.5.
4
In the From text field, type 1.
5
In the To text field, type 0.
6
Click to expand the Smoothing section. In the Size of transition zone text field, type 5.
Optionally, you can inspect the shape of the step function:
7
Variables 1
1
In the Home toolbar, click  Variables and choose Global Variables.
2
In the Settings window for Variables, locate the Variables section.
3
Geometry 1
Import 1 (imp1)
First, import the steering wheel part from a CAD design file.
1
In the Home toolbar, click  Import.
2
In the Settings window for Import, locate the Import section.
3
Click Browse.
4
5
Click Import.
6
Locate the Selections of Resulting Entities section. Find the Cumulative selection subsection. Click New.
7
In the New Cumulative Selection dialog box, type Wheel in the Name text field.
8
Second, draw the mold and cooling channels. To simplify this step, insert a prepared geometry sequence from file. After insertion you can study each geometry step in the sequence.
9
Click the  Zoom Extents button in the Graphics toolbar.
10
In the Geometry toolbar, click  Insert Sequence.
11
12
In the Geometry toolbar, click  Build All.
13
Click the  Zoom Extents button in the Graphics toolbar.
14
Click the  Transparency button in the Graphics toolbar.
Work Plane 1 (wp1)
Create the selections to simplify the model specification.
1
In the Model Builder window, click Work Plane 1 (wp1).
2
In the Settings window for Work Plane, locate the Selections of Resulting Entities section.
3
Find the Cumulative selection subsection. Click New.
4
In the New Cumulative Selection dialog box, type Cooling channels in the Name text field.
5
Materials
The next step is to specify material properties for the model. First, select water from the built-in materials database.
Add Material
1
In the Home toolbar, click  Add Material to open the Add Material window.
2
Go to the Add Material window.
3
In the tree, select Built-in>Water, liquid.
4
Click Add to Component in the window toolbar.
Materials
Water, liquid (mat1)
1
In the Settings window for Material, locate the Geometric Entity Selection section.
2
From the Geometric entity level list, choose Edge.
3
From the Selection list, choose Cooling channels.
Material Switch 1 (sw1)
Define the mold materials to switch between during a solver sweep.
1
In the Materials toolbar, click  More Materials and choose Local>Material Switch.
2
Add Material
1
Go to the Add Material window.
2
In the tree, select Built-in>Aluminum.
3
Click  Add to Material Switch 1 (sw1).
4
In the tree, select Built-in>Steel AISI 4340.
5
Click  Add to Material Switch 1 (sw1).
6
In the Materials toolbar, click  Add Material to close the Add Material window.
Materials
Polyurethane
Next, create a material with the properties of polyurethane.
1
In the Model Builder window, under Component 1 (comp1) right-click Materials and choose Blank Material.
2
In the Settings window for Material, type Polyurethane in the Label text field.
3
Locate the Geometric Entity Selection section. From the Selection list, choose Wheel.
4
Locate the Material Contents section. In the table, enter the following settings:
Nonisothermal Pipe Flow (nipfl)
1
In the Model Builder window, under Component 1 (comp1) click Nonisothermal Pipe Flow (nipfl).
2
In the Settings window for Nonisothermal Pipe Flow, locate the Edge Selection section.
3
From the Selection list, choose Cooling channels.
Pipe Properties 1
1
In the Model Builder window, under Component 1 (comp1)>Nonisothermal Pipe Flow (nipfl) click Pipe Properties 1.
2
In the Settings window for Pipe Properties, locate the Pipe Shape section.
3
4
In the di text field, type 1[cm].
5
Locate the Flow Resistance section. From the Surface roughness list, choose User defined.
6
In the Surface roughness text field, type e.
Temperature 1
1
In the Model Builder window, click Temperature 1.
2
In the Settings window for Temperature, locate the Temperature section.
3
In the Tin text field, type T_inlet.
Inlet 1
1
In the Physics toolbar, click  Points and choose Inlet.
2
3
In the Settings window for Inlet, locate the Inlet Specification section.
4
From the Specification list, choose Volumetric flow rate.
5
In the qv,0 text field, type Qw.
Heat Outflow 1
1
In the Physics toolbar, click  Points and choose Heat Outflow.
2
Wall Heat Transfer 1
1
In the Physics toolbar, click  Edges and choose Wall Heat Transfer.
2
In the Settings window for Wall Heat Transfer, locate the Edge Selection section.
3
From the Selection list, choose Cooling channels.
4
Locate the Heat Transfer Model section. From the Text list, choose Temperature (ht).
Internal Film Resistance 1
In the Physics toolbar, click  Attributes and choose Internal Film Resistance.
Initial Values 1
1
In the Model Builder window, click Initial Values 1.
2
In the Settings window for Initial Values, locate the Initial Values section.
3
In the u text field, type 0.1.
4
In the T text field, type T_init_mold.
Heat Transfer in Solids (ht)
Initial Values 1
1
In the Model Builder window, under Component 1 (comp1)>Heat Transfer in Solids (ht) click Initial Values 1.
2
In the Settings window for Initial Values, locate the Initial Values section.
3
In the T2 text field, type T_init_mold.
Heat Flux 1
1
In the Physics toolbar, click  Boundaries and choose Heat Flux.
2
In the Settings window for Heat Flux, locate the Boundary Selection section.
3
From the Selection list, choose All boundaries.
4
Locate the Heat Flux section. Click the Convective heat flux button.
5
In the h text field, type 2.
Mesh 1
Edge 1
1
In the Model Builder window, under Component 1 (comp1) right-click Mesh 1 and choose More Operations>Edge.
2
In the Settings window for Edge, locate the Edge Selection section.
3
From the Selection list, choose Cooling channels.
Size 1
1
Right-click Edge 1 and choose Size.
2
In the Settings window for Size, locate the Element Size section.
3
From the Predefined list, choose Extra fine.
Free Tetrahedral 1
1
In the Model Builder window, right-click Mesh 1 and choose Free Tetrahedral.
Even with a maximum element size of 0.003 m, the mesh contains some collapsed elements, resulting in solver errors. Trial and error gives that lowering the curvature factor somewhat will create a mesh with good quality.
Size
1
In the Model Builder window, click Size.
2
In the Settings window for Size, locate the Element Size section.
3
Click the Custom button.
4
Locate the Element Size Parameters section. In the Minimum element size text field, type 0.003.
5
In the Curvature factor text field, type 0.55.
6
In the Model Builder window, right-click Mesh 1 and choose Build All.
Study 1
Step 1: Time Dependent
1
In the Model Builder window, under Study 1 click Step 1: Time Dependent.
2
In the Settings window for Time Dependent, locate the Study Settings section.
3
In the Output times text field, type range(0,2,28) range(30,30,600).
Definitions
To evaluate the average temperature of the polyurethane part for different conditions and mold materials (Figure 8), perform parametric and material sweeps. To avoid accumulating a lot of data while solving, keep only last solution and save the average wheel temperature in a table. For this purpose, add a global probe to the model.
Domain Probe 1 (dom1)
1
In the Definitions toolbar, click  Probes and choose Domain Probe.
2
In the Settings window for Domain Probe, locate the Source Selection section.
3
From the Selection list, choose Wheel.
4
Click Replace Expression in the upper-right corner of the Expression section. From the menu, choose Component 1 (comp1)>Heat Transfer in Solids>Temperature>T2 - Temperature - K.
5
Locate the Expression section. Select the Description check box.
6
In the associated text field, type Average wheel temperature.
Study 1
Parametric Sweep
1
In the Study toolbar, click  Parametric Sweep.
2
In the Settings window for Parametric Sweep, locate the Study Settings section.
3
From the Sweep type list, choose All combinations.
4
5
6
7
Locate the Output While Solving section. Select the Accumulated probe table check box.
8
Locate the Study Settings section. Find the Memory settings for jobs subsection. From the Keep solutions list, choose Only last.
Material Sweep
1
In the Study toolbar, click  Material Sweep.
2
In the Settings window for Material Sweep, locate the Study Settings section.
3
Solution 1 (sol1)
1
In the Study toolbar, click  Show Default Solver.
2
In the Model Builder window, expand the Solution 1 (sol1) node.
Since the problem involves only heat conduction, you can solved it more efficiently by relaxing nonlinear setting.
3
In the Model Builder window, expand the Study 1>Solver Configurations>Solution 1 (sol1)>Time-Dependent Solver 1 node, then click Fully Coupled 1.
4
In the Settings window for Fully Coupled, click to expand the Method and Termination section.
5
In the Damping factor text field, type 1.
6
From the Jacobian update list, choose Minimal.
7
In the Maximum number of iterations text field, type 4.
8
In the Study toolbar, click  Compute.
Results
Study 1/Solution 1 (4) (sol1)
In the Results toolbar, click  More Datasets and choose Solution.
Selection
1
In the Results toolbar, click  Attributes and choose Selection.
2
In the Settings window for Selection, locate the Geometric Entity Selection section.
3
From the Geometric entity level list, choose Domain.
4
From the Selection list, choose Wheel.
Study 1/Solution 1 (5) (sol1)
In the Results toolbar, click  More Datasets and choose Solution.
Study 1/Solution 1 (4) (sol1)
In the Model Builder window, click Study 1/Solution 1 (4) (sol1).
Selection
1
In the Results toolbar, click  Attributes and choose Selection.
2
In the Settings window for Selection, locate the Geometric Entity Selection section.
3
From the Geometric entity level list, choose Boundary.
4
Temperature (nipfl)
1
In the Model Builder window, click Temperature (nipfl).
2
In the Settings window for 3D Plot Group, locate the Data section.
3
From the Time (s) list, choose 120.
Line 1
1
In the Model Builder window, expand the Temperature (nipfl) node, then click Line 1.
2
In the Settings window for Line, locate the Coloring and Style section.
3
Select the Radius scale factor check box.
4
5
Clear the Color legend check box.
Surface 1
1
In the Model Builder window, right-click Temperature (nipfl) and choose Surface.
2
In the Settings window for Surface, locate the Data section.
3
From the Dataset list, choose Probe Solution 3 (sol1).
4
From the Time (s) list, choose 120.
5
Click Replace Expression in the upper-right corner of the Expression section. From the menu, choose Component 1 (comp1)>Heat Transfer in Solids>Temperature>T2 - Temperature - K.
6
In the Temperature (nipfl) toolbar, click  Plot.
7
Click the  Zoom Extents button in the Graphics toolbar.
Temperature (ht)
1
In the Model Builder window, click Temperature (ht).
2
In the Settings window for 3D Plot Group, locate the Data section.
3
From the Time (s) list, choose 120.
4
In the Temperature (ht) toolbar, click  Plot.
Surface
1
In the Model Builder window, expand the Temperature (ht) node, then click Surface.
2
In the Settings window for Surface, locate the Coloring and Style section.
3
From the Color table list, choose Rainbow.
4
In the Temperature (ht) toolbar, click  Plot.
5
Click the  Transparency button in the Graphics toolbar.
3D Plot Group 7
In the Home toolbar, click  Add Plot Group and choose 3D Plot Group.
Surface 1
1
Right-click 3D Plot Group 7 and choose Surface.
2
In the Settings window for Surface, locate the Data section.
3
From the Dataset list, choose Study 1/Solution 1 (4) (sol1).
4
From the Solution parameters list, choose From parent.
5
Click Replace Expression in the upper-right corner of the Expression section. From the menu, choose Component 1 (comp1)>Heat Transfer in Solids>Temperature>T2 - Temperature - K.
Slice 1
1
In the Model Builder window, right-click 3D Plot Group 7 and choose Slice.
2
In the Settings window for Slice, locate the Data section.
3
From the Dataset list, choose Study 1/Solution 1 (4) (sol1).
4
From the Solution parameters list, choose From parent.
5
Locate the Plane Data section. In the Planes text field, type 4.
6
Click to expand the Inherit Style section. From the Plot list, choose Surface 1.
7
Click Replace Expression in the upper-right corner of the Expression section. From the menu, choose Component 1 (comp1)>Heat Transfer in Solids>Temperature>T2 - Temperature - K.
Mold Temperature
1
In the Model Builder window, under Results click 3D Plot Group 7.
2
In the Settings window for 3D Plot Group, type Mold Temperature in the Label text field.
3
Click to expand the Title section. From the Title type list, choose Manual.
4
In the Title text area, type Time=600 s Surface: Temperature (K) .
Surface 2
1
Right-click Mold Temperature and choose Surface.
2
In the Settings window for Surface, locate the Data section.
3
From the Dataset list, choose Probe Solution 3 (sol1).
4
From the Solution parameters list, choose From parent.
5
Locate the Expression section. In the Expression text field, type 0.
6
Locate the Coloring and Style section. From the Coloring list, choose Uniform.
7
From the Color list, choose Gray.
Line 1
1
Right-click Mold Temperature and choose Line.
2
In the Settings window for Line, click Replace Expression in the upper-right corner of the Expression section. From the menu, choose Component 1 (comp1)>Nonisothermal Pipe Flow (Heat Transfer in Pipes)>T - Temperature - K.
3
Locate the Coloring and Style section. From the Line type list, choose Tube.
4
In the Tube radius expression text field, type 0.5*nipfl.dh.
5
Select the Radius scale factor check box.
6
From the Coloring list, choose Uniform.
7
From the Color list, choose Blue.
8
In the Mold Temperature toolbar, click  Plot.
9
Click the  Transparency button in the Graphics toolbar.
Evaluate the average temperature of the polyurethane part for different conditions and mold materials(Figure 8).
Accumulated Probe Table 1
1
In the Model Builder window, expand the Results>Tables node, then click Accumulated Probe Table 1.
2
In the Settings window for Table, locate the Data section.
3
From the Presentation format list, choose Filled.
4
Click  Update.
Accumulated Probe Table 1.1
1
Right-click Accumulated Probe Table 1 and choose Duplicate.
2
In the Settings window for Table, locate the Data section.
3
Find the Filled table structure subsection. From the Parameter value list, choose 2: matsw.comp1.sw1=1, Qw=1.6667E-4.
Accumulated Probe Table 1.2
1
Right-click Accumulated Probe Table 1 and choose Duplicate.
2
In the Settings window for Table, locate the Data section.
3
Find the Filled table structure subsection. From the Parameter value list, choose 3: matsw.comp1.sw1=2, Qw=3.3333E-4.
Accumulated Probe Table 1.3
1
Right-click Accumulated Probe Table 1 and choose Duplicate.
2
In the Settings window for Table, locate the Data section.
3
Find the Filled table structure subsection. From the Parameter value list, choose 4: matsw.comp1.sw1=2, Qw=1.6667E-4.
Probe Table Graph 1
1
In the Model Builder window, expand the Results>Probe Plot Group 6 node, then click Probe Table Graph 1.
2
In the Settings window for Table Graph, locate the Data section.
3
From the Table list, choose Accumulated Probe Table 1.
4
From the Plot columns list, choose All excluding x-axis.
5
Click to expand the Legends section. From the Legends list, choose Manual.
6
7
In the Probe Plot Group 6 toolbar, click  Plot.
Probe Table Graph 1.1
1
Right-click Probe Table Graph 1 and choose Duplicate.
2
In the Settings window for Table Graph, locate the Data section.
3
From the Table list, choose Accumulated Probe Table 1.1.
4
Locate the Legends section. In the table, enter the following settings:
Probe Table Graph 1.2
1
Right-click Probe Table Graph 1 and choose Duplicate.
2
In the Settings window for Table Graph, locate the Data section.
3
From the Table list, choose Accumulated Probe Table 1.2.
4
Locate the Legends section. In the table, enter the following settings:
Probe Table Graph 1.2.1
1
Right-click Probe Table Graph 1.2 and choose Duplicate.
2
In the Settings window for Table Graph, locate the Data section.
3
From the Table list, choose Accumulated Probe Table 1.3.
4
Locate the Legends section. In the table, enter the following settings:
Average Temperature
1
In the Model Builder window, under Results click Probe Plot Group 6.
2
In the Settings window for 1D Plot Group, type Average Temperature in the Label text field.
3
In the Average Temperature toolbar, click  Plot.