PDF

Dielectrophoretic Separation of Platelets from Red Blood Cells
Introduction
By exploiting the fact that platelets are the smallest cells in blood, it is possible to perform size-based fractionation of blood (that is, separate platelets from red blood cells) using dielectrophoresis, a force produced by a spatially nonuniform electric field that can even affect electrically neutral particles. This model demonstrates the continuous separation of platelets from red blood cells (RBCs) using the Dielectrophoretic Force feature available in the Particle Tracing for Fluid Flow interface.
Model Definition
Dielectrophoresis is the movement of particles in a nonuniform electric field due to the interaction of the particles’ induced dipoles with the spatial gradient of the electric field norm.
When the electric field is computed in the frequency domain, the Dielectrophoretic Force feature adds the following contribution to the total force exerted on the particles:
where
rp (SI unit: m) is the radius of a spherical particle in the field,
ε0 = 8.854187817·1012 F/m is the vacuum permittivity,
Erms (SI unit: V/m) is the root mean square electric field.
For fields that are computed in the frequency domain, the complex permittivity can be expressed as
where ε (SI unit: F/m) is the permittivity, σ (SI unit: S/m) is the electrical conductivity, and ω (SI unit: Hz) is the angular frequency of the electric field.
The Shell subnode can be added to the Dielectrophoretic Force node to model the dielectrophoretic (DEP) force on particles with thin dielectric shells. The complex permittivity of the shell can differ from the complex permittivity of the rest of the particle. When computing the dielectrophoretic force, the complex permittivity of the particle is replaced by the equivalent complex relative permittivity of a homogeneous particle comprising both the shell and the interior of the particle:
where
ro and ri (SI unit: m) are the outer and inner radii of the shell, respectively,
For this model, the shell parameters for platelets and RBCs are respectively obtained from Ref. 2 and Ref. 3.
The present model is based on a lab-on-a-chip device described in detail in Ref. 1. It consists of two inlets, two outlets, and a separation region in which a nonuniform electric field created by an arrangement of electrodes of alternating polarity alter the particle trajectories. Figure 1 shows the schematic of the modeled geometry. As seen on the figure, the inlet velocity for the lower inlet is significantly higher (853 μm/s) than the upper inlet (154 μm/s) in order to focus all the injected particles toward the upper outlet.
Figure 1: Two dimensional geometry of the modeled device. Details are presented in Ref. 1. The inlet velocity for the bottom inlet is significantly higher than the upper inlet to focus all the injected particles toward the upper outlet (Flow Focusing).
The model uses the following physics interfaces:
Three studies are also used:
1
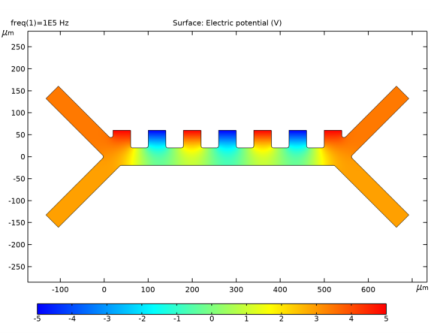
Study 1 (Stationary and Frequency Domain) solves for the fluid velocity, pressure, and AC electric potential.
2
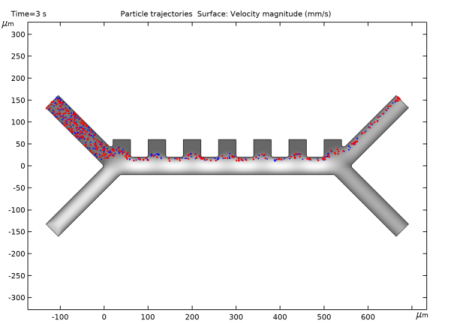
Study 2 (Time Dependent) estimates the particle trajectories in the flow without the DEP force, so that all particles (platelets and RBC) follow the same path.
3
Study 3 (Time Dependent) computes the particle trajectories including the DEP force.
Results and Discussion
Figure 2 shows the electric potential in the channel. When no dielectrophoretic force is applied, the red blood cells and platelets follow the same path and exit through the same outlet, as shown in Figure 3. When the dielectrophoretic force is applied, the two species are separated due to the differences in their dielectric properties, as shown in Figure 4.
Figure 2: Spatial variation of the electric potential in the microfluidic channel.
Figure 3: Particle trajectories without dielectrophoretic force applied. The RBCs are displayed in red and the platelets in blue. Since the particles are released at the same time and follow a similar path, the platelets are hidden behind the RBCs on the figure.
Figure 4: Particle trajectories with dielectrophoretic force applied. The RBCs are displayed in red and the platelets in blue. For sake of visualization, the relative size of the RBCs has been divided by two.
References
1. N. Piacentini, G. Mernier, R. Tornay, and P. Renaud, “Separation of platelets from other blood cells in continuous-flow by dielectrophoresis field-flow-fractionation,” Biomicrofluidics, vol. 5, 034122, 2011.
2. M. Egger and E. Donath, “Electrorotation measurements of diamide-induced platelet activation changes,” Biophysical Journal, vol. 68, pp. 364–372, 1995.
3. S. Park, Y. Zhang, T.H. Wang, and S. Yang, “Continuous dielectrophoretic bacterial separation and concentration from physiological media of high conductivity,” Supplementary information, Lab on a Chip, vol. 11, pp. 2893–2900, 2011.
Application Library path: Particle_Tracing_Module/Fluid_Flow/dielectrophoretic_separation
Modeling Instructions
From the File menu, choose New.
New
In the New window, click  Model Wizard.
Model Wizard
1
In the Model Wizard window, click  2D.
2
In the Select Physics tree, select AC/DC>Electric Fields and Currents>Electric Currents (ec).
3
Click Add.
4
In the Select Physics tree, select Fluid Flow>Single-Phase Flow>Creeping Flow (spf).
5
Click Add.
6
In the Select Physics tree, select Fluid Flow>Particle Tracing>Particle Tracing for Fluid Flow (fpt).
7
Click Add.
8
Geometry 1
Insert the prepared geometry sequence from file. You can read the instructions for creating the geometry in the appendix.
1
In the Geometry toolbar, click  Insert Sequence.
2
Global Definitions
Parameters 1
Load the model parameters from a file.
1
In the Model Builder window, under Global Definitions click Parameters 1.
2
In the Settings window for Parameters, locate the Parameters section.
3
Click  Load from File.
4
Electric Currents (ec)
Electric Potential 1
1
In the Model Builder window, under Component 1 (comp1) right-click Electric Currents (ec) and choose Electric Potential.
2
In the Settings window for Electric Potential, locate the Electric Potential section.
3
In the V0 text field, type 5.
4
Electric Potential 2
1
In the Physics toolbar, click  Boundaries and choose Electric Potential.
2
In the Settings window for Electric Potential, locate the Electric Potential section.
3
In the V0 text field, type -5.
4
Creeping Flow (spf)
In the Model Builder window, under Component 1 (comp1) click Creeping Flow (spf).
Inlet 1
1
In the Physics toolbar, click  Boundaries and choose Inlet.
2
3
In the Settings window for Inlet, locate the Velocity section.
4
In the U0 text field, type 134[um/s].
Inlet 2
1
In the Physics toolbar, click  Boundaries and choose Inlet.
2
3
In the Settings window for Inlet, locate the Velocity section.
4
In the U0 text field, type 853[um/s].
Outlet 1
1
In the Physics toolbar, click  Boundaries and choose Outlet.
2
Particle Tracing for Fluid Flow (fpt)
1
In the Model Builder window, under Component 1 (comp1) click Particle Tracing for Fluid Flow (fpt).
2
In the Settings window for Particle Tracing for Fluid Flow, locate the Particle Release and Propagation section.
3
From the Formulation list, choose Newtonian, ignore inertial terms.
This formulation is chosen because the Lagrangian response time of the particles is about six orders of magnitude smaller than the time for the particles to flow through the channel.
Platelets
1
In the Model Builder window, under Component 1 (comp1)>Particle Tracing for Fluid Flow (fpt) click Particle Properties 1.
2
In the Settings window for Particle Properties, type Platelets in the Label text field.
3
Locate the Particle Properties section. From the ρp list, choose User defined. In the associated text field, type rho_p.
4
In the dp text field, type dp1.
Red Blood Cells
1
In the Physics toolbar, click  Global and choose Particle Properties.
2
In the Settings window for Particle Properties, type Red Blood Cells in the Label text field.
3
Locate the Particle Properties section. From the ρp list, choose User defined. In the associated text field, type rho_p.
4
In the dp text field, type dp2.
Inlet, Platelets
1
In the Physics toolbar, click  Boundaries and choose Inlet.
2
In the Settings window for Inlet, type Inlet, Platelets in the Label text field.
3
4
Locate the Release Times section. In the Release times text field, type range(0,0.01,3).
5
Locate the Initial Position section. From the Initial position list, choose Random.
Inlet, Red Blood Cells
1
Right-click Inlet, Platelets and choose Duplicate.
2
In the Settings window for Inlet, type Inlet, Red Blood Cells in the Label text field.
3
Click to expand the Released Particle Properties section. From the Released particle properties list, choose Red Blood Cells.
Outlet 1
1
In the Physics toolbar, click  Boundaries and choose Outlet.
2
Drag Force 1
1
In the Physics toolbar, click  Domains and choose Drag Force.
2
3
In the Settings window for Drag Force, locate the Drag Force section.
4
From the u list, choose Velocity field (spf).
5
Locate the Additional Terms section. Select the Include virtual mass and pressure gradient forces check box.
Dielectrophoretic Force, Platelets
1
In the Physics toolbar, click  Domains and choose Dielectrophoretic Force.
2
In the Settings window for Dielectrophoretic Force, type Dielectrophoretic Force, Platelets in the Label text field.
3
4
Locate the Dielectrophoretic Force section. From the E list, choose Electric field (ec/cucn1).
5
Locate the Advanced Settings section. Select the Use piecewise polynomial recovery on field check box.
6
From the Particles to affect list, choose Single species.
Shell 1
1
In the Physics toolbar, click  Attributes and choose Shell.
2
In the Settings window for Shell, locate the Shell Properties section.
3
In the ts text field, type th_s1.
4
In the εr,s text field, type epsilon_s1.
5
In the σs text field, type sigma_s1.
Dielectrophoretic Force, Red Blood Cells
1
In the Model Builder window, right-click Dielectrophoretic Force, Platelets and choose Duplicate.
2
In the Settings window for Dielectrophoretic Force, type Dielectrophoretic Force, Red Blood Cells in the Label text field.
3
Locate the Advanced Settings section. From the Affected particle properties list, choose Red Blood Cells.
Shell 1
1
In the Model Builder window, expand the Dielectrophoretic Force, Red Blood Cells node, then click Shell 1.
2
In the Settings window for Shell, locate the Shell Properties section.
3
In the ts text field, type th_s2.
4
In the εr,s text field, type epsilon_s2.
5
In the σs text field, type sigma_s2.
Platelets
1
In the Model Builder window, click Platelets.
2
In the Settings window for Particle Properties, locate the Additional Material Properties section.
3
From the εr,p list, choose User defined. In the associated text field, type epsilon_p1.
4
From the σp list, choose User defined. In the associated text field, type sigma_p1.
Red Blood Cells
1
In the Model Builder window, click Red Blood Cells.
2
In the Settings window for Particle Properties, locate the Additional Material Properties section.
3
From the εr,p list, choose User defined. In the associated text field, type epsilon_p2.
4
From the σp list, choose User defined. In the associated text field, type sigma_p2.
Materials
Material 1 (mat1)
1
In the Model Builder window, under Component 1 (comp1) right-click Materials and choose Blank Material.
2
In the Settings window for Material, locate the Material Contents section.
3
Add a Stationary and a Frequency Domain study step to respectively solve the fluid flow and electric potential in the channel.
Add Study
1
In the Home toolbar, click  Add Study to open the Add Study window.
2
Go to the Add Study window.
3
Find the Physics interfaces in study subsection. In the table, clear the Solve check boxes for Electric Currents (ec) and Particle Tracing for Fluid Flow (fpt).
4
Find the Studies subsection. In the Select Study tree, select General Studies>Stationary.
5
Click Add Study in the window toolbar.
6
In the Home toolbar, click  Add Study to close the Add Study window.
Study 1
Frequency Domain
1
In the Study toolbar, click  Study Steps and choose Frequency Domain>Frequency Domain.
2
In the Settings window for Frequency Domain, locate the Study Settings section.
3
In the Frequencies text field, type f0.
4
Locate the Physics and Variables Selection section. In the table, clear the Solve for check boxes for Creeping Flow (spf) and Particle Tracing for Fluid Flow (fpt).
5
In the Study toolbar, click  Compute.
Results
Electric Potential (ec)
1
In the Settings window for 2D Plot Group, locate the Color Legend section.
2
From the Position list, choose Bottom.
3
Click the  Zoom Extents button in the Graphics toolbar. Compare the resulting plot to Figure 2.
Velocity (spf)
1
In the Model Builder window, click Velocity (spf).
2
In the Settings window for 2D Plot Group, locate the Color Legend section.
3
From the Position list, choose Bottom.
Add a Time Dependent study to compute the trajectories of the particles without the Dielectrophoretic Force feature.
Add Study
1
In the Study toolbar, click  Add Study to open the Add Study window.
2
Go to the Add Study window.
3
Find the Physics interfaces in study subsection. In the table, clear the Solve check boxes for Electric Currents (ec) and Creeping Flow (spf).
4
Find the Studies subsection. In the Select Study tree, select General Studies>Time Dependent.
5
Click Add Study in the window toolbar.
6
In the Study toolbar, click  Add Study to close the Add Study window.
Study 2, no Dielectrophoretic Force
1
In the Model Builder window, click Study 2.
2
In the Settings window for Study, type Study 2, no Dielectrophoretic Force in the Label text field.
Step 1: Time Dependent
1
In the Model Builder window, under Study 2, no Dielectrophoretic Force click Step 1: Time Dependent.
2
In the Settings window for Time Dependent, locate the Study Settings section.
3
In the Output times text field, type range(0,0.05,3).
4
Locate the Physics and Variables Selection section. Select the Modify model configuration for study step check box.
5
In the Physics and variables selection tree, select Component 1 (comp1)>Particle Tracing for Fluid Flow (fpt)>Dielectrophoretic Force, Platelets and Component 1 (comp1)>Particle Tracing for Fluid Flow (fpt)>Dielectrophoretic Force, Red Blood Cells.
6
Click  Disable.
Check the values of variables not solved for in order to get access to the velocity field and electric potential computed in the first study.
7
Click to expand the Values of Dependent Variables section. Find the Values of variables not solved for subsection. From the Settings list, choose User controlled.
8
From the Method list, choose Solution.
9
From the Study list, choose Study 1, Frequency Domain.
Get the initial solution. The purpose is to generate a plot of the particule trajectories and use it to plot the particles while solving for them.
10
In the Study toolbar, click  Get Initial Value.
Results
Particle Trajectories (fpt)
Modify the plot to display the particle size and electric potential.
1
In the Settings window for 2D Plot Group, locate the Color Legend section.
2
Clear the Show legends check box.
For clearer visualization use an if statement to display the RBCs with a diameter two times smaller than their real size.
Particle Trajectories 1
1
In the Model Builder window, expand the Particle Trajectories (fpt) node, then click Particle Trajectories 1.
2
In the Settings window for Particle Trajectories, locate the Coloring and Style section.
3
Find the Point style subsection. In the Point radius expression text field, type if(fpt.sidx==2,dp2/2,dp1).
Color Expression 1
1
In the Model Builder window, expand the Particle Trajectories 1 node, then click Color Expression 1.
2
In the Settings window for Color Expression, locate the Expression section.
3
In the Expression text field, type fpt.dp.
4
Locate the Coloring and Style section. From the Color table list, choose WaveLight.
Surface 1
1
In the Model Builder window, right-click Particle Trajectories (fpt) and choose Surface.
2
In the Settings window for Surface, click Replace Expression in the upper-right corner of the Expression section. From the menu, choose Component 1 (comp1)>Creeping Flow>Velocity and pressure>spf.U - Velocity magnitude - m/s.
3
Locate the Expression section. From the Unit list, choose mm/s.
4
Locate the Coloring and Style section. From the Color table list, choose GrayScale.
Set a custom range to make the particles easier to see in the regions with slow-moving fluid.
5
Click to expand the Range section. Select the Manual color range check box.
6
In the Minimum text field, type -1.
7
In the Maximum text field, type 1.5.
8
Click the  Zoom Extents button in the Graphics toolbar.
Plot the particle trajectories while solving. Note that the dielectrophoretic force is not applied in this study, so all of the particles appear follow approximately the same trajectory.
Study 2, no Dielectrophoretic Force
Step 1: Time Dependent
1
In the Model Builder window, under Study 2, no Dielectrophoretic Force click Step 1: Time Dependent.
2
In the Settings window for Time Dependent, click to expand the Results While Solving section.
3
Select the Plot check box.
4
From the Plot group list, choose Particle Trajectories (fpt).
5
In the Study toolbar, click  Compute.
Results
Particle Trajectories (fpt)
Click the  Zoom Extents button in the Graphics toolbar. The plot should look like Figure 3.
Now add another Time Dependent study to compute the effect of the dielectrophoretic force on the particle trajectories.
Add Study
1
In the Study toolbar, click  Add Study to open the Add Study window.
2
Go to the Add Study window.
3
Find the Physics interfaces in study subsection. In the table, clear the Solve check boxes for Electric Currents (ec) and Creeping Flow (spf).
4
Find the Studies subsection. In the Select Study tree, select General Studies>Time Dependent.
5
Click Add Study in the window toolbar.
6
In the Study toolbar, click  Add Study to close the Add Study window.
Study 3, Dielectrophoretic Force
1
In the Model Builder window, click Study 3.
2
In the Settings window for Study, type Study 3, Dielectrophoretic Force in the Label text field.
Step 1: Time Dependent
1
In the Model Builder window, under Study 3, Dielectrophoretic Force click Step 1: Time Dependent.
2
In the Settings window for Time Dependent, locate the Study Settings section.
3
In the Output times text field, type range(0,0.05,3).
4
Locate the Values of Dependent Variables section. Find the Values of variables not solved for subsection. From the Settings list, choose User controlled.
5
From the Method list, choose Solution.
6
From the Study list, choose Study 1, Frequency Domain.
Get the initial solution in order to view the particle trajectories while running the study.
7
In the Study toolbar, click  Get Initial Value.
Results
Particle Trajectories (fpt) 1
1
In the Settings window for 2D Plot Group, locate the Color Legend section.
2
Clear the Show legends check box.
Particle Trajectories 1
1
In the Model Builder window, expand the Particle Trajectories (fpt) 1 node, then click Particle Trajectories 1.
2
In the Settings window for Particle Trajectories, locate the Coloring and Style section.
3
Find the Point style subsection. In the Point radius expression text field, type if(fpt.dp==dp2,dp2/2,dp1).
Color Expression 1
1
In the Model Builder window, expand the Particle Trajectories 1 node, then click Color Expression 1.
2
In the Settings window for Color Expression, locate the Expression section.
3
In the Expression text field, type fpt.dp.
4
Locate the Coloring and Style section. From the Color table list, choose WaveLight.
Surface 1
1
In the Model Builder window, right-click Particle Trajectories (fpt) 1 and choose Surface.
2
In the Settings window for Surface, click Replace Expression in the upper-right corner of the Expression section. From the menu, choose Component 1 (comp1)>Creeping Flow>Velocity and pressure>spf.U - Velocity magnitude - m/s.
3
Locate the Expression section. From the Unit list, choose mm/s.
4
Locate the Coloring and Style section. From the Color table list, choose GrayScale.
Set a custom range to make the particles easier to see in the regions with slow-moving fluid.
5
Locate the Range section. Select the Manual color range check box.
6
In the Minimum text field, type -1.
7
In the Maximum text field, type 1.5.
Streamline 1
1
Right-click Particle Trajectories (fpt) 1 and choose Streamline.
2
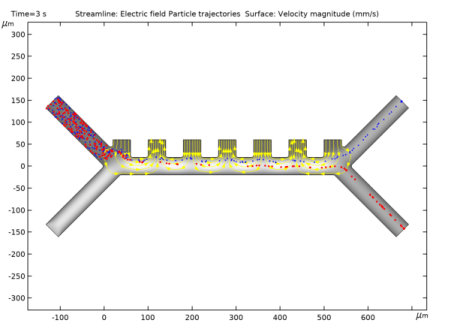
In the Settings window for Streamline, click Replace Expression in the upper-right corner of the Expression section. From the menu, choose Component 1 (comp1)>Electric Currents>Electric>ec.Ex,ec.Ey - Electric field.
3
Locate the Streamline Positioning section. From the Entry method list, choose Coordinates.
4
In the x text field, type range(102.5,5,137.5) range(262.5,5,297.5) range(422.5,5,457.5).
5
In the y text field, type 60.
6
Locate the Coloring and Style section. Find the Point style subsection. From the Color list, choose Yellow.
7
From the Type list, choose Arrow.
8
Select the Number of arrows check box.
9
Moving the Streamline plot will make particles appear on top of the streamlines, rather than the other way around, whenever the two overlap.
10
Click the  Zoom Extents button in the Graphics toolbar.
Plot the particle trajectories while solving. Note that the dielectrophoretic force separates the particles.
Study 3, Dielectrophoretic Force
Step 1: Time Dependent
1
In the Model Builder window, under Study 3, Dielectrophoretic Force click Step 1: Time Dependent.
2
In the Settings window for Time Dependent, locate the Results While Solving section.
3
Select the Plot check box.
4
From the Plot group list, choose Particle Trajectories (fpt) 1.
5
In the Study toolbar, click  Compute.
Results
Particle Trajectories (fpt) 1
1
In the Particle Trajectories (fpt) 1 toolbar, click  Plot.
2
Click the  Zoom Extents button in the Graphics toolbar. Compare the resulting plot to Figure 4.
Appendix — Geometry Instructions
Add Component
In the Home toolbar, click  Add Component and choose 2D.
Geometry 1
1
In the Settings window for Geometry, locate the Units section.
2
From the Length unit list, choose µm.
Rectangle 1 (r1)
1
In the Geometry toolbar, click  Rectangle.
2
In the Settings window for Rectangle, locate the Size and Shape section.
3
In the Width text field, type 560/2.
4
In the Height text field, type 40.
5
Locate the Position section. In the y text field, type -20.
Rectangle 2 (r2)
1
In the Geometry toolbar, click  Rectangle.
2
In the Settings window for Rectangle, locate the Size and Shape section.
3
In the Width text field, type 40.
4
In the Height text field, type 200.
5
Locate the Position section. In the x text field, type 9.
6
In the y text field, type -9.
7
Locate the Rotation Angle section. In the Rotation text field, type 45.
Mirror 1 (mir1)
1
In the Geometry toolbar, click  Transforms and choose Mirror.
2
3
In the Settings window for Mirror, locate the Normal Vector to Line of Reflection section.
4
In the x text field, type 0.
5
In the y text field, type 1.
6
Locate the Input section. Select the Keep input objects check box.
Mirror 2 (mir2)
1
In the Geometry toolbar, click  Transforms and choose Mirror.
2
Click in the Graphics window and then press Ctrl+A to select all objects.
3
In the Settings window for Mirror, locate the Input section.
4
Select the Keep input objects check box.
5
Locate the Point on Line of Reflection section. In the x text field, type 560/2.
Square 1 (sq1)
1
In the Geometry toolbar, click  Square.
2
In the Settings window for Square, locate the Size section.
3
In the Side length text field, type 40.
4
Locate the Position section. In the x text field, type 20.
5
In the y text field, type 20.
Array 1 (arr1)
1
In the Geometry toolbar, click  Transforms and choose Array.
2
3
In the Settings window for Array, locate the Size section.
4
In the x size text field, type 7.
5
Locate the Displacement section. In the x text field, type 80.
Union 1 (uni1)
1
In the Geometry toolbar, click  Booleans and Partitions and choose Union.
Use the select box icon to select all the geometry objects.
2
Click in the Graphics window and then press Ctrl+A to select all objects.
3
In the Settings window for Union, locate the Union section.
4
Clear the Keep interior boundaries check box.
Fillet 1 (fil1)
1
In the Geometry toolbar, click  Fillet.
2
On the object uni1, select Points 5, 6, 8, 9, 11, 13, 15, 17, 19, 22, 24, 26, 28, 30, 32, 34, 35, and 37 only.
3
In the Settings window for Fillet, locate the Radius section.
4
In the Radius text field, type 5.
5
Click  Build All Objects.