PDF

Polynomial Hyperelastic Model
Introduction
This example shows how you can implement a user defined hyperelastic material, using the strain energy density function. The implemented model is a general Mooney-Rivlin hyperelastic material model defined by a polynomial.
For such a material model, the strain energy density function has the following expression:
Here 1 and 2 are the first and second invariant of the left isochoric Cauchy-Green deformation tensor, Jel is the elastic Jacobian, Ci,j are coefficients in the polynomial, and K is the bulk modulus.
In this example, you implement two material models based on the above expression: a two parameter equation and a five parameter equation. The two parameter Mooney-Rivlin material model implementation is then validated with the results obtained with the built-in Mooney-Rivlin hyperelastic material.
Model Definition
A simple geometry is used consisting of a single block of the hyperelastic material as shown in Figure 1. The block is fixed at one face and loaded with an uniform normal load of 1 MPa at the opposite face. Due to symmetry, only one quarter of the geometry is represented.
Figure 1: Model geometry with boundary conditions and loads.
The two parameter Mooney-Rivlin material model is defined by the following strain energy density:
The five parameter Mooney-Rivlin material model is defined by the following strain energy density:
Note: Both the two parameter and the five parameter Mooney-Rivlin material model are available in the Hyperelastic Material node.
Results and Discussion
Figure 2 shows the y-component of the second Piola-Kirchhoff stress along the center axis of the block. You can see that the results from the two parameter polynomial equation model perfectly matches the results of the built-in Mooney-Rivlin material.
Figure 2: Stress plot (y-component of the second Piola-Kirchhoff stress) along the length of the block.
Figure 3 shows the von Mises stress distribution in the geometry obtained with the two parameter Mooney-Rivlin material. Figure 4 shows the von Mises stress distribution in the geometry with the five parameter Mooney-Rivlin material model. Note the difference in deformation: the five parameter polynomial model has a significantly smaller deformation than the two parameter model
For the five parameter material, you can see that the stress in the region far away from the fixed end is significantly lower than for the two parameter material. This is because the area reduction is much larger with the more flexible two parameter material, although, the total load is the same in both cases. The von Mises stress is computed from the Cauchy stress, which is based on force per current area.
Figure 3: Distribution of the von Mises stress for the two parameter polynomihal hyperelastic material model.
Figure 4: Distribution of the von Mises stress for the five parameter polynomial hyperelastic material model.
Notes About the COMSOL Implementation
Instead of using the predefined hyperelastic material model, you manually define the material in the Hyperelastic Material node’s Settings window. In the Hyperelastic Material section, select User defined from the Material model list.
For nearly incompressible materials, the strain energy density is defined using a separation of the isochoric strain energy density and the volumetric strain energy density.
When you use a hyperelastic material in your model, all studies automatically become geometrically nonlinear.
Application Library path: Nonlinear_Structural_Materials_Module/Hyperelasticity/polynomial_hyperelastic
Modeling Instructions
From the File menu, choose New.
New
In the New window, click  Model Wizard.
Model Wizard
1
In the Model Wizard window, click  3D.
2
In the Select Physics tree, select Structural Mechanics>Solid Mechanics (solid).
3
Click Add.
4
Click  Study.
5
In the Select Study tree, select General Studies>Stationary.
6
Global Definitions
Parameters 1
1
In the Model Builder window, under Global Definitions click Parameters 1.
2
In the Settings window for Parameters, locate the Parameters section.
3
Geometry 1
Block 1 (blk1)
1
In the Geometry toolbar, click  Block.
2
In the Settings window for Block, locate the Size and Shape section.
3
In the Width text field, type 0.1.
4
In the Depth text field, type 0.05.
5
In the Height text field, type 0.02.
6
Locate the Rotation Angle section. In the Rotation text field, type -90.
7
Click  Build All Objects.
8
Click the  Zoom Extents button in the Graphics toolbar.
Definitions
Variables 1
1
In the Home toolbar, click  Variables and choose Local Variables.
2
In the Settings window for Variables, locate the Variables section.
3
Solid Mechanics (solid)
Fixed Constraint 1
1
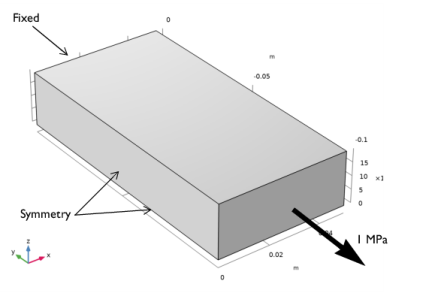
In the Model Builder window, under Component 1 (comp1) right-click Solid Mechanics (solid) and choose Fixed Constraint.
2
Symmetry 1
1
In the Physics toolbar, click  Boundaries and choose Symmetry.
2
Boundary Load 1
1
In the Physics toolbar, click  Boundaries and choose Boundary Load.
2
3
In the Settings window for Boundary Load, locate the Force section.
4
Specify the FA vector as
Two parameter Polynomial Hyperelastic Material Model
Polynomial, Two Parameters
1
In the Physics toolbar, click  Domains and choose Hyperelastic Material.
2
In the Settings window for Hyperelastic Material, type Polynomial, Two Parameters in the Label text field.
3
Locate the Domain Selection section. From the Selection list, choose All domains.
4
Locate the Hyperelastic Material section. From the Material model list, choose User defined.
5
From the Compressibility list, choose Nearly incompressible material.
6
In the Wsiso text field, type Wsiso_MR2.
7
In the Wsvol text field, type Wsvol.
Mesh 1
Mapped 1
1
In the Mesh toolbar, click  Boundary and choose Mapped.
2
Distribution 1
1
Right-click Mapped 1 and choose Distribution.
2
3
In the Settings window for Distribution, locate the Distribution section.
4
From the Distribution type list, choose Predefined.
5
In the Number of elements text field, type 4.
6
In the Element ratio text field, type 5.
7
Select the Reverse direction check box.
Distribution 2
1
In the Model Builder window, right-click Mapped 1 and choose Distribution.
2
3
In the Settings window for Distribution, locate the Distribution section.
4
From the Distribution type list, choose Predefined.
5
In the Number of elements text field, type 6.
6
In the Element ratio text field, type 5.
Swept 1
In the Mesh toolbar, click  Swept.
Distribution 1
1
Right-click Swept 1 and choose Distribution.
2
In the Settings window for Distribution, locate the Distribution section.
3
From the Distribution type list, choose Predefined.
4
In the Number of elements text field, type 15.
5
In the Element ratio text field, type 5.
6
Click  Build All.
Mooney-Rivlin Hyperelastic Material Model
Mooney-Rivlin
1
In the Physics toolbar, click  Domains and choose Hyperelastic Material.
2
In the Settings window for Hyperelastic Material, type Mooney-Rivlin in the Label text field.
3
Locate the Domain Selection section. From the Selection list, choose All domains.
4
Locate the Hyperelastic Material section. From the Material model list, choose Mooney-Rivlin, two parameters.
5
From the C10 list, choose User defined. In the associated text field, type C10.
6
From the C01 list, choose User defined. In the associated text field, type C01.
7
In the κ text field, type kappa.
Polynomial, Five Parameters
1
In the Model Builder window, right-click Polynomial, Two Parameters and choose Duplicate.
2
In the Settings window for Hyperelastic Material, type Polynomial, Five Parameters in the Label text field.
3
Locate the Hyperelastic Material section. In the Wsiso text field, type Wsiso_MR5.
The five parameter Mooney-Rivlin material is also available as predefined hyperelastic material.
First solve the two parameter polynomial model.
Study: Polynomial, Two Parameters
1
In the Model Builder window, click Study 1.
2
In the Settings window for Study, type Study: Polynomial, Two Parameters in the Label text field.
Step 1: Stationary
1
In the Model Builder window, under Study: Polynomial, Two Parameters click Step 1: Stationary.
2
In the Settings window for Stationary, locate the Physics and Variables Selection section.
3
Select the Modify model configuration for study step check box.
4
In the Physics and variables selection tree, select Component 1 (comp1)>Solid Mechanics (solid), Controls spatial frame>Mooney-Rivlin and Component 1 (comp1)>Solid Mechanics (solid), Controls spatial frame>Polynomial, Five Parameters.
5
Click  Disable.
6
In the Home toolbar, click  Compute.
Results
Stress (Polynomial, Two Parameters)
In the Settings window for 3D Plot Group, type Stress (Polynomial, Two Parameters) in the Label text field.
Surface 1
1
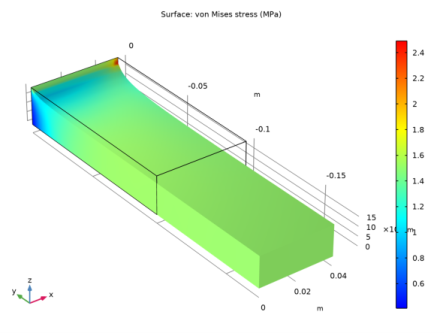
In the Model Builder window, expand the Stress (Polynomial, Two Parameters) node, then click Surface 1.
2
In the Settings window for Surface, locate the Expression section.
3
From the Unit list, choose MPa.
4
In the Stress (Polynomial, Two Parameters) toolbar, click  Plot.
5
Click the  Go to Default View button in the Graphics toolbar.
Volume Maximum 1
1
In the Results toolbar, click  More Derived Values and choose Maximum>Volume Maximum.
2
In the Settings window for Volume Maximum, locate the Selection section.
3
From the Selection list, choose All domains.
4
Click Replace Expression in the upper-right corner of the Expressions section. From the menu, choose Component 1 (comp1)>Solid Mechanics>Displacement>Displacement field - m>v - Displacement field, Y component.
5
Click to expand the Advanced section. From the Find maximum of list, choose Absolute value.
6
Click  Evaluate.
Now solve the Monney-Rivlin model.
Add Study
1
In the Home toolbar, click  Add Study to open the Add Study window.
2
Go to the Add Study window.
3
Find the Studies subsection. In the Select Study tree, select General Studies>Stationary.
4
Click Add Study in the window toolbar.
5
In the Home toolbar, click  Add Study to close the Add Study window.
Study 2
Step 1: Stationary
1
In the Settings window for Stationary, locate the Physics and Variables Selection section.
2
Select the Modify model configuration for study step check box.
3
In the Physics and variables selection tree, select Component 1 (comp1)>Solid Mechanics (solid), Controls spatial frame>Polynomial, Five Parameters.
4
Click  Disable.
5
In the Model Builder window, click Study 2.
6
In the Settings window for Study, type Study: Mooney-Rivlin in the Label text field.
7
In the Home toolbar, click  Compute.
Results
Stress (Mooney-Rivlin)
In the Settings window for 3D Plot Group, type Stress (Mooney-Rivlin) in the Label text field.
Surface 1
1
In the Model Builder window, expand the Stress (Mooney-Rivlin) node, then click Surface 1.
2
In the Settings window for Surface, locate the Expression section.
3
From the Unit list, choose MPa.
4
Click the  Go to Default View button in the Graphics toolbar.
Volume Maximum 1
1
In the Model Builder window, click Volume Maximum 1.
2
In the Settings window for Volume Maximum, locate the Data section.
3
From the Dataset list, choose Study: Mooney-Rivlin/Solution 2 (sol2).
4
Click  Evaluate.
Now solve the five parameter polynomial model.
Add Study
1
In the Home toolbar, click  Add Study to open the Add Study window.
2
Go to the Add Study window.
3
Find the Studies subsection. In the Select Study tree, select General Studies>Stationary.
4
Click Add Study in the window toolbar.
5
In the Home toolbar, click  Add Study to close the Add Study window.
Study: Polynomial, Five Parameters
1
In the Model Builder window, click Study 3.
2
In the Settings window for Study, type Study: Polynomial, Five Parameters in the Label text field.
3
In the Home toolbar, click  Compute.
Results
Stress (Polynomial, Five Parameters)
In the Settings window for 3D Plot Group, type Stress (Polynomial, Five Parameters) in the Label text field.
Surface 1
1
In the Model Builder window, expand the Stress (Polynomial, Five Parameters) node, then click Surface 1.
2
In the Settings window for Surface, locate the Expression section.
3
From the Unit list, choose MPa.
4
In the Stress (Polynomial, Five Parameters) toolbar, click  Plot.
5
Click the  Go to Default View button in the Graphics toolbar.
Volume Maximum 1
1
In the Model Builder window, click Volume Maximum 1.
2
In the Settings window for Volume Maximum, locate the Data section.
3
From the Dataset list, choose Study: Polynomial, Five Parameters/Solution 3 (sol3).
4
Click  Evaluate.
To compare the results of the two parameter polynomial model with Mooney-Rivlin results, reproduce Figure 2.
Second Piola-Kirchhoff Stress, Y component
1
In the Home toolbar, click  Add Plot Group and choose 1D Plot Group.
2
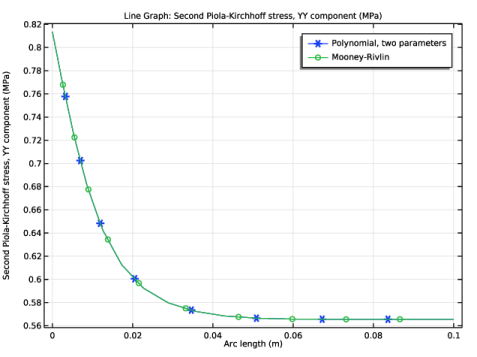
In the Settings window for 1D Plot Group, type Second Piola-Kirchhoff Stress, Y component in the Label text field.
Line Graph 1
1
In the Second Piola-Kirchhoff Stress, Y component toolbar, click  Line Graph.
2
3
In the Settings window for Line Graph, click Replace Expression in the upper-right corner of the y-Axis Data section. From the menu, choose Component 1 (comp1)>Solid Mechanics>Stress>Second Piola-Kirchhoff stress (material and geometry frames) - N/m²>solid.SYY - Second Piola-Kirchhoff stress, YY component.
4
Locate the y-Axis Data section. From the Unit list, choose MPa.
5
Click to expand the Coloring and Style section. Find the Line markers subsection. From the Marker list, choose Cycle.
6
Click to expand the Legends section. Select the Show legends check box.
7
From the Legends list, choose Manual.
8
Line Graph 2
1
Right-click Line Graph 1 and choose Duplicate.
2
In the Settings window for Line Graph, locate the Data section.
3
From the Dataset list, choose Study: Mooney-Rivlin/Solution 2 (sol2).
4
Locate the Coloring and Style section. Find the Line markers subsection. In the Number text field, type 10.
5
Locate the Legends section. In the table, enter the following settings:
6
Click to expand the Title section. From the Title type list, choose None.
7
In the Second Piola-Kirchhoff Stress, Y component toolbar, click  Plot.