PDF

Quadrupole Lens
Introduction
Just like optical lenses focus light, electric and magnetic lenses can focus beams of charged particles. Systems of magnetic quadrupole lenses find a common use in focusing both ion and particle beams in accelerators at nuclear and particle physics centers such as CERN, SLAC, and ISIS. This COMSOL Multiphysics model shows the path of B5+ ions going through three consecutive magnetic quadrupole lenses. The model is set up in a cross section of the geometry.
Model Definition
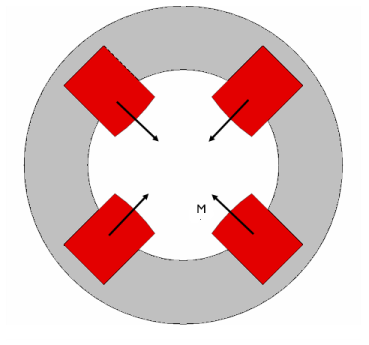
The quadrupole consists of an assembly of four permanent magnets, as seen in Figure 1 below, where the magnets work together to give a good approximation of a quadrupole field. To strengthen the field and keep it contained within the system, the magnets are set in an iron cylinder.
Figure 1: Cross-sectional view of one of the magnetic quadrupoles used in the lens.
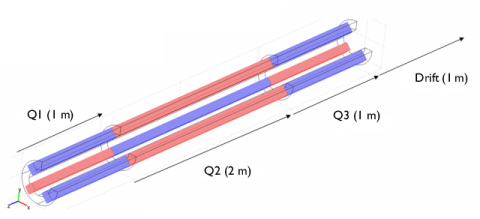
The ions are sent through a system of three consecutive quadrupole assemblies. The middle one is twice as long as the other ones, and is rotated by 90 degrees around the central axis. This means the polarity of its magnets is reversed. Figure 2 gives a full view of the magnetic quadrupole lens.
Figure 2: Cutout of the quadrupole lens. The second quadrupole (Q2) has its polarities reversed compared to Q1 and Q3. After traveling through the lens, the ions are left to drift 1 m.
An accelerator feeds the system with ions traveling with the velocity 0.01 c along the central axis. To study the focusing effect of the quadrupoles, track a number of ions starting out from a distance of 3 cm from the central axis, evenly distributed along the circumference of a circle in the transverse plane. They are all assumed to have a zero initial transverse velocity. Each quadrupole focuses the ion beam along one of the transverse axes and defocuses it along the other one. The net effect after traveling through the system of the three quadrupoles and the drift length is focusing in all directions. As the ions exit the system, they are all contained within a 1 cm radius in the transverse plane.
The model is set up in a 2D cross section of any of the two identical quadrupoles Q1 and Q3. Neglecting fringe fields, the transverse magnetic field at a given point in a transverse plane in Q2 automatically has the same magnitude as the corresponding in Q1 and Q3, but point in the opposite direction. It is therefore sufficient to model the fields in one of the quadrupoles.
Domain Equations
The magnetic field is described using the Magnetostatics equation, solving for the z component of the magnetic potential A (Wb/m):
Here μ0 = 4π·107 H/m denotes the permeability of vacuum, M is the magnetization (A/m), σ the conductivity (S/m), and v the velocity of the medium (m/s). In this example, the medium is not moving. The right-hand side of the equation holds an imposed current, specified in terms of an external current density Jze (A/m2). No currents are imposed. The iron domain uses a slightly different formulation of the same equation:
where μr = 4000 is the relative permeability. The magnetic potential is everywhere defined so that B = ∇ × A. 
Boundary Conditions
The magnetic field is approximately parallel to the exterior boundary of the iron cylinder. To enforce this, use the magnetic insulation boundary condition, stating that Az  =  0.
Results and Discussion
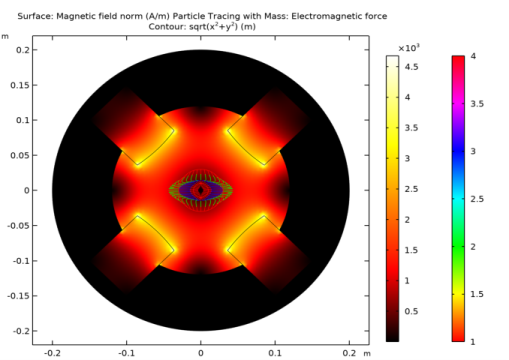
The magnetic field density and streamlines in a cross section of Q1 or Q3 appear in Figure 3 below.
Figure 3: The magnetic field density and flow lines in the center of one of the quadrupole magnets.
Each ion passing through the assembly experiences a Maxwell force equal to F = qv × B, where v (m/s) is the ion’s velocity. Next, assume that the z component of the velocity is constant and much larger than the x and y (transverse) components. Thus consider only the force contributions from the z component of the velocity. To find the transverse position as a function of time, you need to solve Newton’s second law for each ion, qv × B = ma, where m is the ion mass (kg), and a denotes its acceleration (m/s2). If the computed magnetic flux density in Q1 equals B', and the length of quadrupole i is Li (m), the flux density that the ion experiences is given by
where t (s) is the time of flight. This dependency of the magnetic flux density on the time of flight is fed to the particle-tracing algorithm as a logical expression. Figure 4 below shows how the ions travel in the transverse plane.
Figure 4: As the ions enter Q1, they start out evenly distributed around the larger circle, 3 cm from the z-axis. Q1 focuses along the x-axis and defocuses along the y-axis. The force on each ion is approximately proportional to its distance from the z-axis, so as the ions enter Q2, those that are far out on the x-axis rapidly turn around and move toward the center. Q3 stabilizes the motion and gets all ions on the right track. Finally the ions are left to drift toward a waist situated a little bit more than 1 m beyond Q3.
Application Library path: COMSOL_Multiphysics/Electromagnetics/quadrupole
Modeling Instructions
From the File menu, choose New.
New
In the New window, click  Model Wizard.
Model Wizard
1
In the Model Wizard window, click  2D.
2
In the Select Physics tree, select AC/DC>Electromagnetic Fields>Magnetic Fields (mf).
3
Click Add.
4
Click  Study.
5
In the Select Study tree, select General Studies>Stationary.
6
Global Definitions
Parameters 1
1
In the Model Builder window, under Global Definitions click Parameters 1.
2
In the Settings window for Parameters, locate the Parameters section.
3
Here, c_const, mp_const and e_const are predefined constants for, respectively, the speed of light, the mass of the proton and the elementary charge.
Geometry 1
Rectangle 1 (r1)
1
In the Geometry toolbar, click  Rectangle.
2
In the Settings window for Rectangle, locate the Size and Shape section.
3
In the Width text field, type 0.177.
4
In the Height text field, type 0.07.
5
Locate the Position section. In the y text field, type -0.035.
6
Click  Build Selected.
Rotate 1 (rot1)
1
In the Geometry toolbar, click  Transforms and choose Rotate.
2
3
In the Settings window for Rotate, locate the Rotation section.
4
In the Angle text field, type 45.
5
Click  Build Selected.
6
Click the  Zoom Extents button in the Graphics toolbar.
Circle 1 (c1)
1
In the Geometry toolbar, click  Circle.
2
In the Settings window for Circle, locate the Size and Shape section.
3
In the Radius text field, type 0.2.
4
Locate the Position section. In the x text field, type 0.2.
5
In the y text field, type 0.2.
6
Click  Build Selected.
7
Click the  Zoom Extents button in the Graphics toolbar.
Intersection 1 (int1)
1
In the Geometry toolbar, click  Booleans and Partitions and choose Intersection.
2
Click in the Graphics window and then press Ctrl+A to select both objects.
3
In the Settings window for Intersection, click  Build Selected.
Rotate 2 (rot2)
1
In the Geometry toolbar, click  Transforms and choose Rotate.
2
3
In the Settings window for Rotate, locate the Rotation section.
4
In the Angle text field, type 90, 180, 270.
5
Locate the Input section. Select the Keep input objects check box.
6
Click  Build Selected.
7
Click the  Zoom Extents button in the Graphics toolbar.
Now make two circles centered at the origin.
Circle 2 (c2)
1
In the Geometry toolbar, click  Circle.
2
In the Settings window for Circle, locate the Size and Shape section.
3
In the Radius text field, type 0.2.
4
Click  Build Selected.
5
Click the  Zoom Extents button in the Graphics toolbar.
Circle 3 (c3)
1
In the Geometry toolbar, click  Circle.
2
In the Settings window for Circle, locate the Size and Shape section.
3
In the Radius text field, type 0.12.
4
Click  Build Selected.
Create a composite object subtracting the magnets from the union of the two circles. This complex operation can be done in one step by using the Compose geometry operation and specifying the formula.
Compose 1 (co1)
1
In the Geometry toolbar, click  Booleans and Partitions and choose Compose.
2
Click in the Graphics window and then press Ctrl+A to select all objects.
3
In the Settings window for Compose, locate the Compose section.
4
In the Set formula text field, type c2+c3-(int1+rot2(1)+rot2(2)+rot2(3)).
5
Click  Build Selected.
Make one more circle centered at the origin.
Circle 4 (c4)
1
In the Geometry toolbar, click  Circle.
2
In the Settings window for Circle, locate the Size and Shape section.
3
In the Radius text field, type 0.2.
4
Click  Build Selected.
5
Click the  Zoom Extents button in the Graphics toolbar.
Add Material
1
In the Home toolbar, click  Add Material to open the Add Material window.
2
Go to the Add Material window.
3
In the tree, select Built-in>Iron.
4
Click Add to Component in the window toolbar.
5
In the Home toolbar, click  Add Material to close the Add Material window.
Materials
Iron (mat1)
Select Domain 2 only.
Magnetic Fields (mf)
Use the default condition, Magnetic Insulation, on all exterior boundaries.
Ampère’s Law 2
1
In the Model Builder window, under Component 1 (comp1) right-click Magnetic Fields (mf) and choose Ampère’s Law.
2
3
In the Settings window for Ampère’s Law, locate the Constitutive Relation B-H section.
4
From the Magnetization model list, choose Magnetization.
5
Specify the M vector as
6
Locate the Constitutive Relation Jc-E section. From the σ list, choose User defined. Locate the Constitutive Relation D-E section. From the εr list, choose User defined.
Ampère’s Law 3
1
In the Physics toolbar, click  Domains and choose Ampère’s Law.
2
3
In the Settings window for Ampère’s Law, locate the Constitutive Relation B-H section.
4
From the Magnetization model list, choose Magnetization.
5
Specify the M vector as
6
Locate the Constitutive Relation Jc-E section. From the σ list, choose User defined. Locate the Constitutive Relation D-E section. From the εr list, choose User defined.
Ampère’s Law 4
1
In the Physics toolbar, click  Domains and choose Ampère’s Law.
2
3
In the Settings window for Ampère’s Law, locate the Constitutive Relation B-H section.
4
From the Magnetization model list, choose Magnetization.
5
Specify the M vector as
6
Locate the Constitutive Relation Jc-E section. From the σ list, choose User defined. Locate the Constitutive Relation D-E section. From the εr list, choose User defined.
Ampère’s Law 5
1
In the Physics toolbar, click  Domains and choose Ampère’s Law.
2
3
In the Settings window for Ampère’s Law, locate the Constitutive Relation B-H section.
4
From the Magnetization model list, choose Magnetization.
5
Specify the M vector as
6
Locate the Constitutive Relation Jc-E section. From the σ list, choose User defined. Locate the Constitutive Relation D-E section. From the εr list, choose User defined.
Ampère’s Law 6
1
In the Physics toolbar, click  Domains and choose Ampère’s Law.
2
3
In the Settings window for Ampère’s Law, locate the Constitutive Relation B-H section.
4
From the μr list, choose User defined. Locate the Constitutive Relation Jc-E section. From the σ list, choose User defined. Locate the Constitutive Relation D-E section. From the εr list, choose User defined.
Mesh 1
1
In the Model Builder window, under Component 1 (comp1) click Mesh 1.
2
In the Settings window for Mesh, locate the Physics-Controlled Mesh section.
3
From the Element size list, choose Extra fine.
4
Click  Build All.
Study 1
In the Home toolbar, click  Compute.
Results
Magnetic Flux Density Norm (mf)
The default plot shows the norm of the magnetic flux density. Follow the instructions below to view the magnetic field.
Surface 1
1
In the Model Builder window, expand the Magnetic Flux Density Norm (mf) node, then click Surface 1.
2
In the Settings window for Surface, click Replace Expression in the upper-right corner of the Expression section. From the menu, choose Component 1 (comp1)>Magnetic Fields>Magnetic>mf.normH - Magnetic field norm - A/m.
3
In the Magnetic Flux Density Norm (mf) toolbar, click  Plot.
4
Click the  Zoom Extents button in the Graphics toolbar.
To see how the ions travel through the system of quadrupoles, do the following:
Ions Trajectories
1
In the Home toolbar, click  Add Plot Group and choose 2D Plot Group.
2
In the Settings window for 2D Plot Group, type Ions Trajectories in the Label text field.
Surface 1
1
Right-click Ions Trajectories and choose Surface.
2
In the Settings window for Surface, click Replace Expression in the upper-right corner of the Expression section. From the menu, choose Component 1 (comp1)>Magnetic Fields>Magnetic>mf.normH - Magnetic field norm - A/m.
3
Locate the Coloring and Style section. From the Color table list, choose Thermal.
Ions Trajectories
In the Model Builder window, click Ions Trajectories.
Particle Tracing with Mass 1
1
In the Ions Trajectories toolbar, click  More Plots and choose Particle Tracing with Mass.
Enter the expressions for the Lorentz force acting on the particles.
The position of the particle along the z-axis can be computed using the particle time variable partt.
2
In the Settings window for Particle Tracing with Mass, locate the Total Force section.
3
In the Fx text field, type -q*vz*mf.By*(1-2*(partt>L1/vz)+2*(partt>(L1+L2)/vz)-(partt>(L1+L2+L3)/vz)).
4
In the Fy text field, type q*vz*mf.Bx*(1-2*(partt>L1/vz)+2*(partt>(L1+L2)/vz)-(partt>(L1+L2+L3)/vz)).
5
Click to expand the Mass and Velocity section. In the Mass text field, type m.
6
Locate the Particle Positioning section. In the x text field, type 0.03*cos(range(0,0.05*pi,2*pi)).
7
In the y text field, type 0.03*sin(range(0,0.05*pi,2*pi)).
Color Expression 1
1
Right-click Particle Tracing with Mass 1 and choose Color Expression.
2
In the Settings window for Color Expression, locate the Expression section.
3
In the Expression text field, type 1+(partt>L1/vz)+(partt>(L1+L2)/vz)+(partt>(L1+L2+L3)/vz).
4
Locate the Coloring and Style section. From the Color table list, choose Cyclic.
Particle Tracing with Mass 1
1
In the Model Builder window, click Particle Tracing with Mass 1.
2
In the Settings window for Particle Tracing with Mass, click to expand the Release section.
3
Click to expand the Coloring and Style section. Click to expand the Quality section. Find the ODE solver settings subsection. In the Relative tolerance text field, type 1e-6.
4
Click to expand the Advanced section. Find the Termination subsection. Select the Maximum number of steps check box.
5
6
Find the Instantaneous flow field subsection. Select the End time check box.
7
8
In the Ions Trajectories toolbar, click  Plot.
Contour 1
1
In the Model Builder window, right-click Ions Trajectories and choose Contour.
2
In the Settings window for Contour, locate the Expression section.
3
In the Expression text field, type sqrt(x^2+y^2).
4
Locate the Levels section. From the Entry method list, choose Levels.
5
In the Levels text field, type 0.01 0.03.
6
Locate the Coloring and Style section. From the Coloring list, choose Uniform.
7
From the Color list, choose Custom.
8
Clear the Color legend check box.
9
In the Ions Trajectories toolbar, click  Plot.
Zoom in on the center of the model geometry.