PDF

Diffraction Patterns
Introduction
This example simulates a double-slit interference experiment with water waves or sound. The model mimics the incoming plane-wave excitation with two thin waveguides leading to slits in a screen and computes the diffraction pattern on the other side of the screen.
Model Definition
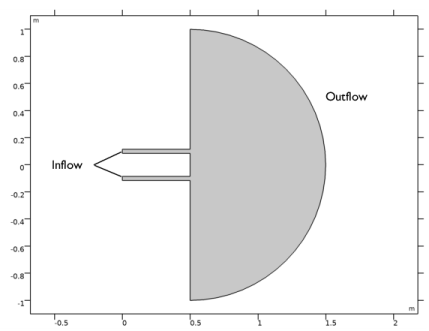
Figure 1 shows the model geometry.
Figure 1: Model geometry with inflow and outflow boundaries indicated. On all other boundaries, a zero flux condition applies.
Theory predicts amplitude minima along rays where the difference in travel distance is an odd multiple of half the wavelength, and maxima at even multiples. For n = 0, ±1, ±2, …:
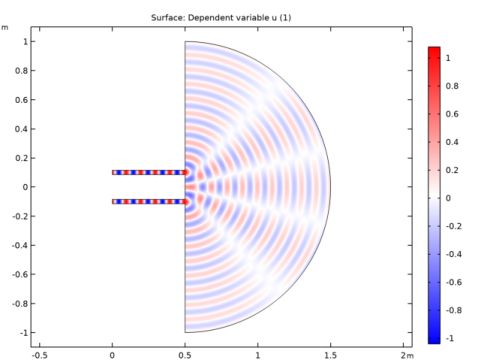
In this example, the distance D between the slits is 2λ. Maxima should then be found at θ = 0° and 30°, while minima should appear at θ = 14.48° and 48.59°.
Equation
For time-harmonic propagation, the wave equation turns into the Helmholtz equation:
Boundary Conditions
On the inflow and outflow boundaries (see Figure 1), absorbing boundary conditions apply. Let us briefly show how such conditions in their simplest form can be derived. First, assume the solution at the boundaries to be the sum of an incident plane wave, uin, propagating in an arbitrary direction and a scattered wave, usc, propagating in the normal direction:
(1)
Here n is the outward boundary normal vector and . At the boundary of the modeling domain, Γ, we then have
(2)
where Equation 1 was used in the second step. It follows that
(3)
There is no incident wave on the outflow boundary, which means that the second term on the right-hand side of Equation 3 vanishes. For the inflow boundary, make the further approximation that the incident wave propagates in the inward normal direction, so that k = −kn. We then arrive at the following boundary conditions:
(4)
In this model, these conditions are readily imposed using the Coefficient Form PDE interface’s Flux/Source condition. The default condition, Zero Flux, applies on the remaining boundaries.
Results and Discussion
The plot in Figure 2 shows the diffraction pattern clearly. The effect of discretization is that the numerical wavelength differs from λ, which results in a shift of the angles. You can correct for this effect by adjusting the value of k in the Helmholtz equation to the element size. These practices are important for modeling the interference effects of monochromatic waves.
Figure 2: Diffraction pattern in the simulated double-slit experiment.
Application Library path: COMSOL_Multiphysics/Equation_Based/diffraction_patterns
Modeling Instructions
From the File menu, choose New.
New
In the New window, click  Model Wizard.
Model Wizard
1
In the Model Wizard window, click  2D.
2
In the Select Physics tree, select Mathematics>PDE Interfaces>Coefficient Form PDE (c).
3
Click Add.
4
Click  Study.
5
In the Select Study tree, select General Studies>Stationary.
6
Global Definitions
Parameters 1
1
In the Model Builder window, under Global Definitions click Parameters 1.
2
In the Settings window for Parameters, locate the Parameters section.
3
Geometry 1
Circle 1 (c1)
1
In the Geometry toolbar, click  Circle.
2
In the Settings window for Circle, locate the Size and Shape section.
3
In the Sector angle text field, type 180.
4
Locate the Position section. In the x text field, type 0.5.
5
Locate the Rotation Angle section. In the Rotation text field, type -90.
6
Click  Build Selected.
Rectangle 1 (r1)
1
In the Geometry toolbar, click  Rectangle.
2
In the Settings window for Rectangle, locate the Size and Shape section.
3
In the Width text field, type 0.5.
4
In the Height text field, type 0.03.
5
Locate the Position section. In the y text field, type -0.015-0.1.
6
Click  Build Selected.
Copy 1 (copy1)
1
In the Geometry toolbar, click  Transforms and choose Copy.
2
3
In the Settings window for Copy, locate the Displacement section.
4
In the y text field, type 0.2.
5
Click  Build Selected.
Union 1 (uni1)
1
In the Geometry toolbar, click  Booleans and Partitions and choose Union.
2
Click in the Graphics window and then press Ctrl+A to select all objects.
3
In the Settings window for Union, locate the Union section.
4
Clear the Keep interior boundaries check box.
5
In the Geometry toolbar, click  Build All.
6
Click the  Zoom Extents button in the Graphics toolbar.
The model geometry is now complete. Next, turn to the physics settings.
Coefficient Form PDE (c)
Coefficient Form PDE 1
1
In the Model Builder window, under Component 1 (comp1)>Coefficient Form PDE (c) click Coefficient Form PDE 1.
2
In the Settings window for Coefficient Form PDE, locate the Absorption Coefficient section.
3
In the a text field, type -k^2.
4
Locate the Source Term section. In the f text field, type 0.
Proceed to apply the boundary conditions Equation 4 at the inflow and outflow boundaries.
Flux/Source 1
1
In the Physics toolbar, click  Boundaries and choose Flux/Source.
2
3
In the Settings window for Flux/Source, locate the Boundary Flux/Source section.
4
In the g text field, type -i*k*u+2*u0*i*k*exp(-i*k*x).
Note that the phase factor in this expression evaluates to 1 because x = 0. It has been included nevertheless for completeness.
Flux/Source 2
1
In the Physics toolbar, click  Boundaries and choose Flux/Source.
2
3
In the Settings window for Flux/Source, locate the Boundary Flux/Source section.
4
In the g text field, type -i*k*u.
Mesh 1
Create a mesh with a maximum element size determined by the wavelength. As a rule of thumb, you need 5 elements per wavelength for quadratic elements (the default for the PDE interface) to fully resolve the wave.
Free Triangular 1
In the Mesh toolbar, click  Free Triangular.
Size
1
In the Model Builder window, click Size.
2
In the Settings window for Size, locate the Element Size section.
3
Click the Custom button.
4
Locate the Element Size Parameters section. In the Maximum element size text field, type l/5.
5
Click  Build All.
Study 1
In the Home toolbar, click  Compute.
Results
2D Plot Group 1
To reproduce the plot shown in Figure 2, just change the color table.
Surface 1
1
In the Model Builder window, expand the 2D Plot Group 1 node, then click Surface 1.
2
In the Settings window for Surface, locate the Coloring and Style section.
3
From the Color table list, choose WaveLight.
4
In the 2D Plot Group 1 toolbar, click  Plot.