PDF

The Blasius Boundary Layer
Introduction
The incompressible boundary layer on a flat plate in the absence of a pressure gradient is usually referred to as the Blasius boundary layer (Ref. 1). The steady, laminar boundary layer developing downstream of the leading edge eventually becomes unstable to Tollmien-Schlichting waves and finally transitions to a fully turbulent boundary layer. Due to its fundamental importance, this type of flow has become the subject of numerous studies on boundary-layer flow, stability, transition, and turbulence. This application considers the first section of the plate where the boundary layer remains steady and laminar, and compares results from incompressible, two-dimensional, single-phase-flow simulations obtained in COMSOL Multiphysics to the Blasius similarity solution. The solutions converge ideally with respect to both mesh refinement and discretization order.
Model Definition
Consider a homogeneous free-stream flow with speed U0 parallel to an infinitely thin, flat plate located along the positive x-axis. The flow is assumed to be steady, symmetric with respect to y, and homogeneous in the z direction. Due to friction, the flow adjacent to the plate is retarded and a thin boundary layer, where the velocity gradually grows from zero to the free-stream value, develops downstream of the leading edge (see Figure 1).
Figure 1: The boundary layer on a flat plate. δ(x) is the boundary-layer thickness, such that u(x, δ(x)) = U0.
A reasonably accurate solution for the flow field can be found by considering the boundary-layer approximation to the steady, incompressible Navier-Stokes equations
(1)
(2)
Introducing a stream function,
and the similarity transformation,
Equation 1 and Equation 2 reduce to the ODE
(3)
COMSOL solves Equation 3 on the interval η ∈ [0, 10] with the boundary conditions
by rewriting the equation as a system of two equations,
and implementing the system within the Coefficient Form PDE interface.
Using the Laminar Flow interface for single-phase flow, the model solves the steady, incompressible Navier-Stokes equation in a domain (xy) ∈ ([-12.1], [00.5]) m with the leading edge of the plate located at x = 0 m. The working fluid is air at a temperature of T = 20 °C and U0 = 0.75 m/s. The simulations uses discretizations with linear basis functions for velocity and pressure (P1+P1) on three different meshes.
Results and Discussion
Figure 2 shows the similarity solution u/U0 = f'(η). At η = 4.99, the deviation from the free-stream value is 1%. This value can be used to define the boundary-layer thickness,
Figure 2: Similarity solution for the streamwise velocity component.
Figure 3 shows a comparison between the Blasius similarity solution and the results from the two-dimensional simulations at xE = 2 m, corresponding to a Reynolds number of Rex = 1.0·105. Only the results from the P1+P1 simulation on the coarse mesh show a significant deviation from the similarity solution. To quantify differences in the results, define the following measure,
Here, η = 10, for which the similarity solution has converged to its asymptotic value to within the numerical precision in the computations.
Figure 3: Comparison between the similarity solution and the two-dimensional simulations.
Table 1 displays deviations from the similarity solution together with the number of degrees of freedom (DOF) for the three simulations. The convergence is displayed in Figure 4 where the mesh size h is calculated as the maximum cell side in the mesh. The curve is close to straight line, which means that the model is in a mesh convergence regime; that is, the solution converges toward the correct solution when the mesh is refined.
6.10·10-2
Figure 4: Convergence rate as a function of inverse maximum cell side.
Notes About the COMSOL Implementation
The relative tolerance is set to 104 in all the solvers to ensure that the equation systems become well converged. All meshes have monotonically increasing element sizes away from the plate, with distributions employing geometric sequences. A nonlocal coupling is set up to enable evaluation of the similarity solution in the two-dimensional model.
Reference
1. H. Blasius, “Grenzschichten in Flüssigkeiten mit kleiner Reibung,” Z. Math. Phys., vol. 56, pp. 1–37, 1908 (Engl. transl. in NACA TM 1256).
Application Library path: COMSOL_Multiphysics/Fluid_Dynamics/blasius_boundary_layer
Modeling Instructions
From the File menu, choose New.
New
In the New window, click  Model Wizard.
Model Wizard
1
In the Model Wizard window, click  1D.
2
In the Select Physics tree, select Mathematics>PDE Interfaces>Coefficient Form PDE (c).
3
Click Add.
4
In the Field name text field, type f.
5
Click  Add Dependent Variable.
6
In the Dependent variables table, enter the following settings:
7
Click  Study.
8
In the Select Study tree, select General Studies>Stationary.
9
Global Definitions
Parameters 1
1
In the Model Builder window, under Global Definitions click Parameters 1.
2
In the Settings window for Parameters, locate the Parameters section.
3
Geometry 1
Interval 1 (i1)
1
In the Model Builder window, under Component 1 (comp1) right-click Geometry 1 and choose Interval.
2
In the Settings window for Interval, locate the Interval section.
3
Coefficient Form PDE (c)
Coefficient Form PDE 1
1
In the Model Builder window, under Component 1 (comp1)>Coefficient Form PDE (c) click Coefficient Form PDE 1.
2
In the Settings window for Coefficient Form PDE, locate the Diffusion Coefficient section.
3
In the c text-field array, type 0 in the first column of the first row.
4
In the c text-field array, type -2 in the second column of the second row.
5
Locate the Absorption Coefficient section. In the a text-field array, type 1 in the second column of the first row.
6
Locate the Source Term section. In the f text-field array, type 0 on the first row.
7
In the f text-field array, type 0 on the second row.
8
Locate the Damping or Mass Coefficient section. In the da text-field array, type 0 in the first column of the first row.
9
In the da text-field array, type 0 in the second column of the second row.
10
Click to expand the Convection Coefficient section. In the β text-field array, type -1 in the first column of the first row.
11
In the β text-field array, type f in the second column of the second row.
Dirichlet Boundary Condition 1
1
In the Physics toolbar, click  Boundaries and choose Dirichlet Boundary Condition.
2
Dirichlet Boundary Condition 2
1
In the Physics toolbar, click  Boundaries and choose Dirichlet Boundary Condition.
2
Click the  Zoom Extents button in the Graphics toolbar.
3
4
In the Settings window for Dirichlet Boundary Condition, locate the Dirichlet Boundary Condition section.
5
Clear the Prescribed value of f check box.
6
In the r2 text field, type 1.
Mesh 1
Edge 1
1
In the Mesh toolbar, click  Edge.
2
In the Settings window for Edge, locate the Domain Selection section.
3
From the Geometric entity level list, choose Entire geometry.
Distribution 1
1
Right-click Edge 1 and choose Distribution.
2
In the Settings window for Distribution, locate the Distribution section.
3
From the Distribution type list, choose Predefined.
4
In the Number of elements text field, type 10000.
5
In the Element ratio text field, type 100.
6
From the Growth formula list, choose Geometric sequence.
7
Click  Build Selected.
Study 1
Solution 1 (sol1)
1
In the Study toolbar, click  Show Default Solver.
2
In the Model Builder window, expand the Solution 1 (sol1) node, then click Stationary Solver 1.
3
In the Settings window for Stationary Solver, locate the General section.
4
In the Relative tolerance text field, type 1e-6.
Allocate more memory than the default suggestion to avoid a warning message. The solver will automatically increase the allocation factor when needed, but changing it manually is more computationally efficient.
5
In the Model Builder window, expand the Study 1>Solver Configurations>Solution 1 (sol1)>Stationary Solver 1 node, then click Direct.
6
In the Settings window for Direct, locate the General section.
7
In the Memory allocation factor text field, type 1.5.
8
In the Study toolbar, click  Compute.
9
In the Model Builder window, right-click Study 1 and choose Rename.
10
In the Rename Study dialog box, type Similarity Solution in the New label text field.
11
Results
Line Graph 1
1
In the Model Builder window, expand the 1D Plot Group 1 node, then click Line Graph 1.
2
In the Settings window for Line Graph, locate the y-Axis Data section.
3
In the Expression text field, type fprime.
4
Click to expand the Legends section. Select the Show legends check box.
5
From the Legends list, choose Manual.
6
1D Plot Group 1
1
In the Model Builder window, click 1D Plot Group 1.
2
In the Settings window for 1D Plot Group, click to expand the Title section.
3
From the Title type list, choose None.
4
Locate the Plot Settings section. Select the x-axis label check box.
5
6
Select the y-axis label check box.
7
8
Locate the Axis section. Select the Manual axis limits check box.
9
In the x minimum text field, type 0.
10
In the x maximum text field, type 10.
11
In the y minimum text field, type 0.
12
In the y maximum text field, type 1.1.
13
Locate the Legend section. From the Position list, choose Lower right.
14
In the 1D Plot Group 1 toolbar, click  Plot.
Definitions
Set up a nonlocal coupling to be able to evaluate the similarity solution in the upcoming 2D model.
General Extrusion 1 (genext1)
1
In the Model Builder window, expand the Component 1 (comp1)>Definitions node.
2
Right-click Definitions and choose Nonlocal Couplings>General Extrusion.
3
4
In the Settings window for General Extrusion, locate the Destination Map section.
5
In the x-expression text field, type root.y/sqrt(b0*root.x).
Add Component
In the Model Builder window, right-click the root node and choose Add Component>2D.
Add Physics
1
In the Home toolbar, click  Add Physics to open the Add Physics window.
2
Go to the Add Physics window.
3
In the tree, select Fluid Flow>Single-Phase Flow>Laminar Flow (spf).
4
Find the Physics interfaces in study subsection. In the table, clear the Solve check box for Similarity Solution.
5
Click Add to Component 2 in the window toolbar.
6
In the Home toolbar, click  Add Physics to close the Add Physics window.
Add Study
1
In the Home toolbar, click  Add Study to open the Add Study window.
2
Go to the Add Study window.
3
Find the Studies subsection. In the Select Study tree, select General Studies>Stationary.
4
Click Add Study in the window toolbar.
5
In the Model Builder window, click the root node.
6
In the Home toolbar, click  Add Study to close the Add Study window.
Geometry 2
In the Model Builder window, under Component 2 (comp2) click Geometry 2.
Rectangle 1 (r1)
1
In the Geometry toolbar, click  Rectangle.
2
In the Settings window for Rectangle, locate the Size and Shape section.
3
In the Width text field, type 3.1.
4
In the Height text field, type 0.5.
5
Locate the Position section. In the x text field, type -1.
6
In the Geometry toolbar, click  Build All.
Point 1 (pt1)
1
In the Geometry toolbar, click  Point.
2
Click  Build All.
Point 2 (pt2)
1
In the Geometry toolbar, click  Point.
2
In the Settings window for Point, locate the Point section.
3
In the y text field, type 0.5.
4
In the Geometry toolbar, click  Build All.
Add Material
1
In the Home toolbar, click  Add Material to open the Add Material window.
2
Go to the Add Material window.
3
4
Click Add to Component in the window toolbar.
5
In the Home toolbar, click  Add Material to close the Add Material window.
Laminar Flow (spf)
In the Model Builder window, under Component 2 (comp2) click Laminar Flow (spf).
Inlet 1
1
In the Physics toolbar, click  Boundaries and choose Inlet.
2
3
In the Settings window for Inlet, locate the Velocity section.
4
In the U0 text field, type U0.
Open Boundary 1
1
In the Physics toolbar, click  Boundaries and choose Open Boundary.
2
Outlet 1
1
In the Physics toolbar, click  Boundaries and choose Outlet.
2
Symmetry 1
1
In the Physics toolbar, click  Boundaries and choose Symmetry.
2
Mesh 2
Mapped 1
In the Mesh toolbar, click  Mapped.
Distribution 1
1
Right-click Mapped 1 and choose Distribution.
2
3
In the Settings window for Distribution, locate the Distribution section.
4
In the Number of elements text field, type 21*N.
Distribution 2
1
In the Model Builder window, right-click Mapped 1 and choose Distribution.
2
3
In the Settings window for Distribution, locate the Distribution section.
4
In the Number of elements text field, type 10*N.
Distribution 3
1
Right-click Mapped 1 and choose Distribution.
2
3
In the Settings window for Distribution, locate the Distribution section.
4
From the Distribution type list, choose Predefined.
5
In the Number of elements text field, type 20*N.
6
In the Element ratio text field, type 15.
7
From the Growth formula list, choose Geometric sequence.
8
Click  Build Selected.
Study 2
Parametric Sweep
1
In the Study toolbar, click  Parametric Sweep.
2
In the Settings window for Parametric Sweep, locate the Study Settings section.
3
4
Step 1: Stationary
1
In the Model Builder window, click Step 1: Stationary.
2
In the Settings window for Stationary, click to expand the Values of Dependent Variables section.
3
Find the Values of variables not solved for subsection. From the Settings list, choose User controlled.
4
From the Method list, choose Solution.
5
From the Study list, choose Similarity Solution, Stationary.
Solution 2 (sol2)
1
In the Study toolbar, click  Show Default Solver.
2
In the Model Builder window, expand the Solution 2 (sol2) node, then click Stationary Solver 1.
3
In the Settings window for Stationary Solver, locate the General section.
4
In the Relative tolerance text field, type 1e-5.
5
In the Model Builder window, expand the Study 2>Solver Configurations>Solution 2 (sol2)>Stationary Solver 1 node, then click Fully Coupled 1.
6
In the Settings window for Fully Coupled, click to expand the Method and Termination section.
7
In the Maximum number of iterations text field, type 50.
8
In the Study toolbar, click  Compute.
Results
Cut Line 2D 1
1
In the Results toolbar, click  Cut Line 2D.
2
In the Settings window for Cut Line 2D, locate the Data section.
3
From the Dataset list, choose Study 2/Parametric Solutions 1 (5) (sol3).
4
Locate the Line Data section. In row Point 1, set x to xE.
5
In row Point 2, set x to xE and y to 10*sqrt(b0*xE).
Line Graph 2
1
In the Model Builder window, under Results>1D Plot Group 1 right-click Line Graph 1 and choose Duplicate.
2
In the Settings window for Line Graph, locate the y-Axis Data section.
3
In the Expression text field, type u/U0.
4
Locate the Data section. From the Dataset list, choose Cut Line 2D 1.
5
Locate the x-Axis Data section. In the Expression text field, type y/sqrt(b0*x).
6
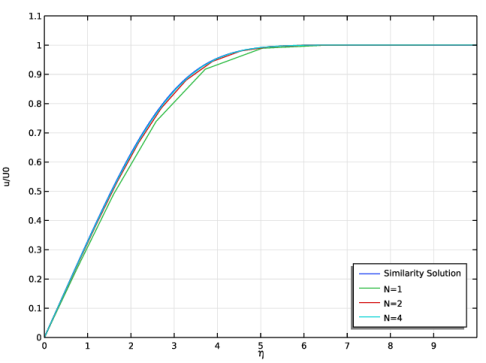
Locate the Legends section. In the table, enter the following settings:
7
In the 1D Plot Group 1 toolbar, click  Plot.
Line Integration 1
1
In the Results toolbar, click  More Derived Values and choose Integration>Line Integration.
2
In the Settings window for Line Integration, locate the Data section.
3
From the Dataset list, choose Cut Line 2D 1.
4
Locate the Expressions section. Click  Clear Table.
5
6
Click  Evaluate.
Surface Minimum 1
1
In the Model Builder window, right-click Derived Values and choose Minimum>Surface Minimum.
2
3
In the Settings window for Surface Minimum, locate the Expressions section.
4
5
Locate the Data section. From the Dataset list, choose Study 2/Parametric Solutions 1 (5) (sol3).
6
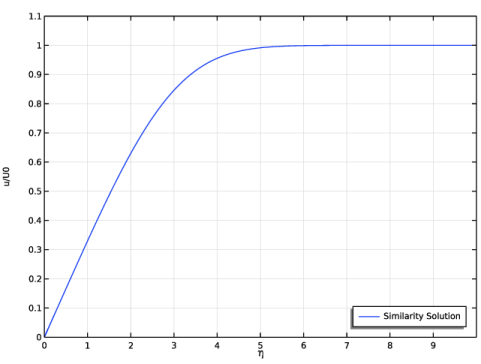
Click the arrow next to the Evaluate button and choose Table 1 - Line Integration 1 ((u/U0-comp1.genext1(fprime))^2/sqrt(b0*x)).
Table
1
Go to the Table window.
2
Click Table Graph in the window toolbar.
Results
Table Graph 1
1
In the Model Builder window, under Results>1D Plot Group 5 click Table Graph 1.
2
In the Settings window for Table Graph, locate the Data section.
3
From the x-axis data list, choose 1/h (1/m).
4
From the Plot columns list, choose Manual.
5
In the Columns list, select Err^2 (1).
6
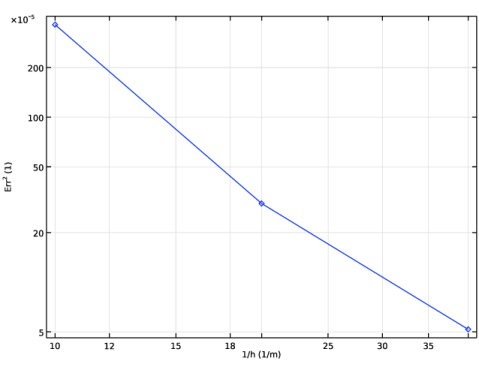
Locate the Coloring and Style section. Find the Line markers subsection. From the Marker list, choose Diamond.
7
From the Positioning list, choose In data points.
8
Click the  y-Axis Log Scale button in the Graphics toolbar.
9
Click the  x-Axis Log Scale button in the Graphics toolbar.