PDF

Electroosmotic Micromixer1
Introduction
Microlaboratories for biochemical applications often require rapid mixing of different fluid streams. At the microscale, flow is usually highly ordered laminar flow, and the lack of turbulence makes diffusion the primary mechanism for mixing. While diffusional mixing of small molecules (and therefore of rapidly diffusing species) can occur in a matter of seconds over distances of tens of micrometers, mixing of larger molecules such as peptides, proteins, and high molecular-weight nucleic acids can require equilibration times from minutes to hours over comparable distances. Such delays are impractically long for many chemical analyses. These problems have led to an intense search for more efficient mixers for microfluidic systems.
Most microscale mixing devices are either passive mixers that use geometrical stirring, or active mixers that use moving parts or external forces, such as pressure or electric field.
In a passive mixer, one way of increasing the mixing is by “shredding” two or several fluids into very thin alternating layers, which decreases the average diffusion length for the molecules between the different fluids. However, these mixers often require very long mixing channels because the different fluids often run in parallel. Another way of improving mixing efficiency is to use active mixers with moving parts that stir the fluids. At the microscale level moving parts in an active mixer are very fragile. One alternative is to use electroosmotic effects to achieve a mixing effect that is perpendicular to the main direction of the flow.
This model takes advantage of electroosmosis to mix fluids. The system applies a time-dependent electric field, and the resulting electroosmosis perturbs the parallel streamlines in the otherwise highly ordered laminar flow.
Model Definition
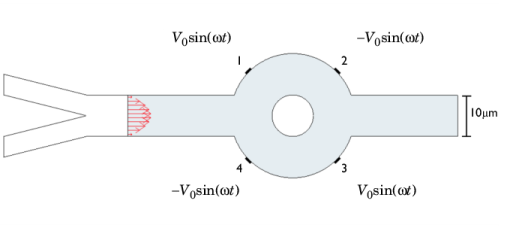
This example of a rather simple micromixer geometry (Figure 1) combines two fluids entering from different inlets into a single 10 μm wide channel. The fluids then enter a ring-shaped mixing chamber that has four microelectrodes placed on the outer wall at angular positions of 45, 135, 45, and 135 degrees, respectively. Assume that the aspect ratio (channel depth to width) is large enough that you can model the mixer using a 2D cross-sectional geometry. The material parameters relevant for the model are given in Table 1.
Figure 1: Geometry of the micromixer with four symmetric electrodes on the wall of the mixing chamber. This example does not model the two inlet channels. Here you assume a parabolic inflow at the beginning of the computational domain (the gray area).
The Navier-Stokes equations for incompressible flow describe the flow in the channels:
Here η denotes the dynamic viscosity (SI unit: kg/(m·s)), u is the velocity (SI unit: m/s), ρ equals the fluid density (SI unit: kg/m3), and p refers to the pressure (SI unit: Pa).
Because you do not model the two inlet channels, assume that the entrance channel starts at a position where the flow has a fully developed laminar profile. The mixed fluid flows freely out of the right end boundary, where you specify vanishing total stress components normal to the boundary:
When brought into contact with an electrolyte, most solid surfaces acquire a surface charge. In response to the spontaneously formed surface charge, a charged solution forms close to the liquid-solid interface. Known as an electric double layer, it forms because of the charged groups located on the surface that faces the solution. When the operator applies an electric field, the electric field generating the electroosmotic flow displaces the charged liquid in the electric double layer. This scheme imposes a force on the positively charged solution close to the wall surface, and the fluid starts to flow in the direction of the electric field. The velocity gradients perpendicular to the wall give rise to viscous transport in this direction. In the absence of other forces, the velocity profile eventually becomes almost uniform in the cross section perpendicular to the wall.
This model replaces the thin electric double layer with the Helmholtz-Smoluchowski relation between the electroosmotic velocity and the tangential component of the applied electric field:
In this equation, εw = ε0εr denotes the fluid’s electric permittivity (F/m), ζ0 represents the zeta potential at the channel wall (V), and V equals the potential (V). This equation applies on all boundaries except for the entrance and the outlet.
Assuming that there are no concentration gradients in the ions that carry the current, you can express the current balance in the channel with Ohm’s law and the balance equation for current density
where σ denotes conductivity (S/m) and the expression within parentheses represents the current density (A/m2).
The electric potentials on the four electrodes are sinusoidal in time with the same maximum value (V0 = 0.1 V) and the same frequency (8 Hz), but they alternate in polarity. The potentials on electrodes 1 and 3 are V0sin(2πft), whereas those on electrodes 2 and 4 are V0sin(2πft) (see Figure 1).
Assume all other boundaries are insulated. The insulation boundary condition
sets the normal component of the electric field to zero.
At the upper half of the inlet (see Figure 1) the solute has a given concentration, c0; at the lower half the concentration is zero. Thus, assume that the concentration changes abruptly from zero to c0 at the middle of the inlet boundary. The mixed solution flows out from the right outlet by convection, and all other boundaries are assumed insulated.
Inside the mixer, the following convection-diffusion equation describes the concentration of the dissolved substances in the fluid:
Here c is the concentration, D represents the diffusion coefficient, R denotes the reaction rate, and u equals the flow velocity. In this model R = 0 because the concentration is not affected by any reactions.
ρ
η
10-3 Pa·s
U0
εr
ζ
σ
10-11 m2/s
c0
Results and Discussion
Figure 2 shows a typical instantaneous streamline pattern. It reveals that electroosmotic recirculation of the fluid vigorously stirs the flow, typically in the form of two rotating vortices near the electrodes.
The fundamental processes of effective mixing involve a combination of repeated stretching and folding of fluid elements in combination with diffusion at small scales. As the system applies the AC field (Figure 3), the resulting electroosmotic flow perturbs the laminar pressure-driven flow such that it pushes the combined stream pattern up and down at the beginning of the mixing chamber, causing extensive folding and stretching of material lines.
Figure 2: Fluid streamlines in an electroosmotic micromixer at t = 0.0375 s.
Figure 3: Electric potential lines for an electroosmotic micromixer. The contour lines show the shape when the device uses maximal potentials (±V0).
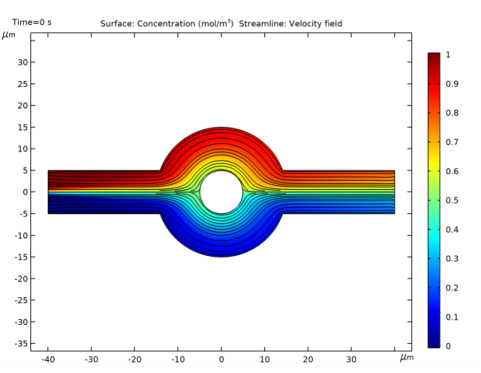
The following plots further exemplify how the mixer operates. Figure 4 shows the concentration at steady state when the electric field is not applied. The flow is laminar and the diffusion coefficient is very small, so the two fluids are well separated also at the outlet. When the alternating electric field is applied, the mixing increases considerably owing to the alternating swirls in the flow. Figure 5 depicts the system at the instant when the electric field and the electroosmotic velocity have their largest magnitudes during the cycle (that is, when |sin ωt| = 1). From the plot you can estimate that the concentration at the output fluctuates with the same frequency as the electric field. Thus, this mixer should be further improved to get a steadier output.
Figure 4: Steady-state solution in the absence of an electric field.
Figure 5: Time-dependent solution at the time when the alternating electric field has its largest magnitude.
This example demonstrates a rather simple and effective use of electrokinetic forces for mixing. The scheme is easy to implement, and you can easily control both the amplitude and the frequency. At low Reynolds numbers the inertial forces are small, which makes it possible to calculate stationary streamlines patterns using the parametric solver to control amplitude.
Notes About the COMSOL Implementation
Cummings and others (Ref. 3) have shown that in order to use the Helmholtz-Smoluchowski equation at the fluid-solid boundaries, the electric field must be at least quasistatic to neglect transient effects. In other words, the time scale of the unsteady electric field must be much larger than that of the transient flow. Y. T. Zhang and others (Ref. 1) estimated that the time scale of the transient effect in the modeled micromixer (with a channel width of 10 microns) is roughly 0.0127 s. In this simulation, the frequency of the applied electric potential is 8 Hz, which corresponds to a time scale of the electric field 10 times larger than that of the flow.
Because you can model the time-dependent electric field as a product of a stationary electric field and a time-dependent phase factor (sinωt), it is possible to reduce the simulation time and memory requirements by dividing the solution into two stages. In the first, calculate the amplitude of the electric potential field and the initial state for the time-dependent flow model using a stationary solver. In the second stage, you deactivate the Electric Currents interface and calculate the transient solution for the Laminar Flow and the Transport of Diluted Species interfaces. You obtain the tangential electric field components used in the electroosmotic velocity boundary condition by multiplying the stationary DC solution by sint). This approach is permissible because there is only a unidirectional dependence between the electric field and the fluid fields.
References
1. H. Chen, Y.T. Zhang, I. Mezic, C.D. Meinhart, and L. Petzold, “Numerical Simulation of an Electroosmotic Micromixer”, Proc Microfluidics 2003 (ASME IMECE), 2003.
2. Y.T. Zhang, H. Chen, I. Mezic, C.D. Meinhart, L. Petzold, and N.C. MacDonald, “SOI Processing of a Ring Electrokinetic Chaotic Micromixer”, Proc NSTI Nanotechnology Conference and Trade Show (Nanotech 2004), vol. 1, pp.  292–295, 2004.
3. E. Cummings, S. Griffiths, R. Nilson, and P. Paul, “Conditions for Similitude Between the Fluid Velocity and the Electric Field in Electroosmotic Flow”, Anal. Chem., vol. 72, pp. 2526–2532, 2000.
Application Library path: Microfluidics_Module/Micromixers/electroosmotic_mixer
Modeling Instructions
From the File menu, choose New.
New
In the New window, click  Model Wizard.
Model Wizard
1
In the Model Wizard window, click  2D.
2
In the Select Physics tree, select Fluid Flow>Single-Phase Flow>Laminar Flow (spf).
3
Click Add.
4
In the Select Physics tree, select AC/DC>Electric Fields and Currents>Electric Currents (ec).
5
Click Add.
6
In the Select Physics tree, select Chemical Species Transport>Transport of Diluted Species (tds).
7
Click Add.
8
Click  Study.
9
In the Select Study tree, select General Studies>Stationary.
10
Global Definitions
Parameters 1
1
In the Model Builder window, under Global Definitions click Parameters 1.
2
In the Settings window for Parameters, locate the Parameters section.
3
You need the constant t (used in the scalar expressions below) when first solving the model using a stationary solver. In the time-dependent simulation, the internal time variable, t, overwrites this constant (the red color is just a warning signaling that t is an internal variable).
Now define a smoothed step function that you will later use to impose a step in the concentration in the middle of the channel entrance.
Step 1 (step1)
1
In the Home toolbar, click  Functions and choose Global>Step.
2
In the Settings window for Step, click to expand the Smoothing section.
3
In the Size of transition zone text field, type 0.1e-6.
Geometry 1
1
In the Model Builder window, under Component 1 (comp1) click Geometry 1.
2
In the Settings window for Geometry, locate the Units section.
3
From the Length unit list, choose µm.
Rectangle 1 (r1)
1
In the Geometry toolbar, click  Rectangle.
2
In the Settings window for Rectangle, locate the Position section.
3
From the Base list, choose Center.
4
Locate the Size and Shape section. In the Width text field, type 80.
5
In the Height text field, type 10.
Circle 1 (c1)
1
In the Geometry toolbar, click  Circle.
2
In the Settings window for Circle, locate the Size and Shape section.
3
In the Radius text field, type 15.
To add vertices for the electrode endpoints on the outer boundary, use the Partition Edges.
Partition Edges 1 (pare1)
1
In the Geometry toolbar, click  Booleans and Partitions and choose Partition Edges.
2
On the object c1, select Boundaries 1–4 only.
3
In the Settings window for Partition Edges, locate the Positions section.
4
Circle 2 (c2)
1
In the Geometry toolbar, click  Circle.
2
In the Settings window for Circle, locate the Size and Shape section.
3
In the Radius text field, type 5.
Compose 1 (co1)
1
In the Geometry toolbar, click  Booleans and Partitions and choose Compose.
2
Click in the Graphics window and then press Ctrl+A to select all objects.
3
In the Settings window for Compose, locate the Compose section.
4
In the Set formula text field, type (r1+pare1)-c2.
5
Clear the Keep interior boundaries check box.
Form Union (fin)
The model geometry is now complete.
Materials
Material 1 (mat1)
1
In the Model Builder window, under Component 1 (comp1) right-click Materials and choose Blank Material.
2
In the Settings window for Material, locate the Material Contents section.
3
Laminar Flow (spf)
1
In the Model Builder window, under Component 1 (comp1) click Laminar Flow (spf).
2
In the Settings window for Laminar Flow, click to expand the Discretization section.
3
From the Discretization of fluids list, choose P2+P1.
Using higher-order elements can improve the accuracy of the solution significantly for low Reynolds number flows such as those in this model.
Inlet 1
1
In the Physics toolbar, click  Boundaries and choose Inlet.
2
3
In the Settings window for Inlet, locate the Boundary Condition section.
4
From the list, choose Fully developed flow.
5
Locate the Fully Developed Flow section. In the Uav text field, type U0.
Outlet 1
1
In the Physics toolbar, click  Boundaries and choose Outlet.
2
Wall 1
1
In the Model Builder window, click Wall 1.
2
In the Settings window for Wall, locate the Boundary Condition section.
3
From the Wall condition list, choose Electroosmotic velocity.
4
Specify the E vector as
5
From the Electroosmotic mobility list, choose Built-in expression.
6
In the ζ text field, type zeta.
7
In the εr text field, type eps_r.
Electric Currents (ec)
In the Model Builder window, under Component 1 (comp1) click Electric Currents (ec).
Electric Potential 1
1
In the Physics toolbar, click  Boundaries and choose Electric Potential.
2
3
In the Settings window for Electric Potential, locate the Electric Potential section.
4
In the V0 text field, type -V0.
Electric Potential 2
1
In the Physics toolbar, click  Boundaries and choose Electric Potential.
2
3
In the Settings window for Electric Potential, locate the Electric Potential section.
4
In the V0 text field, type V0.
Transport of Diluted Species (tds)
Raise the element order to match that of the Laminar Flow interface.
1
In the Model Builder window, under Component 1 (comp1) click Transport of Diluted Species (tds).
2
In the Settings window for Transport of Diluted Species, click to expand the Discretization section.
3
From the Concentration list, choose Quadratic.
Transport Properties 1
1
In the Model Builder window, under Component 1 (comp1)>Transport of Diluted Species (tds) click Transport Properties 1.
2
In the Settings window for Transport Properties, locate the Convection section.
3
From the u list, choose Velocity field (spf).
4
Locate the Diffusion section. In the Dc text field, type D.
Concentration 1
1
In the Physics toolbar, click  Boundaries and choose Concentration.
2
3
In the Settings window for Concentration, locate the Concentration section.
4
Select the Species c check box.
5
In the c0,c text field, type c0*step1(y[1/m]).
The concentration condition on boundaries 1 and 3 gives a sharp but smooth concentration gradient in the middle of the channel entrance.
Outflow 1
1
In the Physics toolbar, click  Boundaries and choose Outflow.
2
Mesh 1
Free Triangular 1
In the Mesh toolbar, click  Free Triangular.
Size
1
In the Model Builder window, click Size.
2
In the Settings window for Size, locate the Element Size section.
3
From the Predefined list, choose Extra fine.
Size 1
1
In the Model Builder window, right-click Free Triangular 1 and choose Size.
2
In the Settings window for Size, locate the Geometric Entity Selection section.
3
From the Geometric entity level list, choose Boundary.
4
5
Locate the Element Size section. Click the Custom button.
6
Locate the Element Size Parameters section. Select the Maximum element size check box.
7
8
Select the Maximum element growth rate check box.
9
10
Click  Build All.
Study 1
Set up the study to start by computing the stationary solution for velocity, pressure, concentration, and electric potential. Then, add a transient simulation stage that solves only for the variables of the Laminar Flow and Transport of Diluted Species interfaces. Begin by adding a study step for the transient part.
Time Dependent
1
In the Study toolbar, click  Study Steps and choose Time Dependent>Time Dependent.
2
In the Settings window for Time Dependent, locate the Study Settings section.
3
In the Output times text field, type range(0,0.125/60,0.5).
4
Locate the Physics and Variables Selection section. In the table, clear the Solve for check box for Electric Currents (ec).
5
In the Model Builder window, click Study 1.
6
In the Settings window for Study, locate the Study Settings section.
7
Clear the Generate default plots check box.
This is convenient if you want to create specialized plots while keeping the number of plot groups down.
Solution 1 (sol1)
1
In the Study toolbar, click  Show Default Solver.
2
In the Model Builder window, expand the Solution 1 (sol1) node, then click Time-Dependent Solver 1.
3
In the Settings window for Time-Dependent Solver, click to expand the Absolute Tolerance section.
4
From the Tolerance method list, choose Manual.
5
In the Absolute tolerance text field, type 5.0E-5.
6
In the Study toolbar, click  Compute.
Results
The following instructions show how to reproduce the plots in the Results and Discussion section.
Velocity, streamlines
1
In the Home toolbar, click  Add Plot Group and choose 2D Plot Group.
2
In the Settings window for 2D Plot Group, type Velocity, streamlines in the Label text field.
3
Locate the Data section. From the Time (s) list, choose 0.0375.
Streamline 1
1
Right-click Velocity, streamlines and choose Streamline.
2
In the Settings window for Streamline, click Replace Expression in the upper-right corner of the Expression section. From the menu, choose Component 1 (comp1)>Laminar Flow>Velocity and pressure>u,v - Velocity field.
3
Locate the Streamline Positioning section. From the Positioning list, choose Uniform density.
4
In the Separating distance text field, type 0.01.
5
In the Velocity, streamlines toolbar, click  Plot.
6
Click the  Zoom Extents button in the Graphics toolbar.
7
Click the  Zoom In button in the Graphics toolbar.
Compare the result with Figure 2.
Electric potential
1
In the Home toolbar, click  Add Plot Group and choose 2D Plot Group.
2
In the Settings window for 2D Plot Group, type Electric potential in the Label text field.
3
Locate the Data section. From the Time (s) list, choose 0.0375.
Contour 1
1
Right-click Electric potential and choose Contour.
2
In the Settings window for Contour, click Replace Expression in the upper-right corner of the Expression section. From the menu, choose Component 1 (comp1)>Electric Currents>Electric>V - Electric potential - V.
3
In the Electric potential toolbar, click  Plot.
4
Click the  Zoom Extents button in the Graphics toolbar.
Compare the result with Figure 3.
Concentration
1
In the Home toolbar, click  Add Plot Group and choose 2D Plot Group.
2
In the Settings window for 2D Plot Group, type Concentration in the Label text field.
Surface 1
1
Right-click Concentration and choose Surface.
2
In the Settings window for Surface, click Replace Expression in the upper-right corner of the Expression section. From the menu, choose Component 1 (comp1)>Transport of Diluted Species>Species c>c - Concentration - mol/m³.
Streamline 1
1
In the Model Builder window, right-click Concentration and choose Streamline.
2
In the Settings window for Streamline, click Replace Expression in the upper-right corner of the Expression section. From the menu, choose Component 1 (comp1)>Laminar Flow>Velocity and pressure>u,v - Velocity field.
3
Locate the Streamline Positioning section. From the Positioning list, choose Uniform density.
4
In the Separating distance text field, type 0.01.
Concentration
1
In the Model Builder window, click Concentration.
2
In the Settings window for 2D Plot Group, locate the Data section.
3
From the Time (s) list, choose 0.
4
In the Concentration toolbar, click  Plot.
Compare the result with Figure 4.
5
From the Time (s) list, choose 0.46875.
6
In the Concentration toolbar, click  Plot.
Compare the result with Figure 5.
 

1
This model is courtesy of H. Chen, Y. T. Zhang, I. Mezic, C. D. Meinhart, and L. Petzold of the University of California, Santa Barbara (Ref. 1 and Ref. 2).