PDF

Droplet Breakup in a T-Junction
Introduction
Emulsions consist of small liquid droplets immersed in another liquid, typically oil in water or water in oil. Emulsions find wide application in the production of food, cosmetics, and pharmaceutical products. The properties and quality of an emulsion typically depend on the size and the distribution off the droplets. This example studies in detail how to create uniform droplets in a microchannel T-junction.
Setting up the model you can make use of the multiphysics coupling feature Laminar Two-Phase Flow, Level Set interface. The model uses the multiphysics coupling wetted wall boundary condition at the solid walls, with a contact angle of 135°. From the results, you can determine the size of the created droplets and the rate with which they are produced.
Model Definition
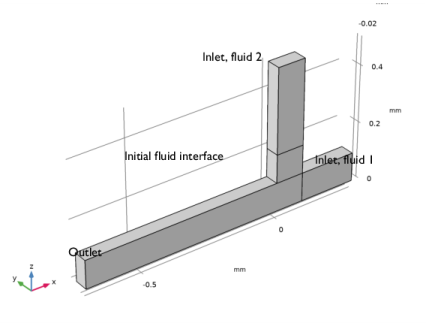
Figure 1 shows the geometry of the T-shaped microchannel with a rectangular cross section. For the separated fluid elements to correspond to droplets, the geometry is modeled in 3D. Due to symmetry, it is sufficient to model only half of the junction geometry. The modeling domain is shown in Figure 1. The fluid to be dispersed into small droplets, Fluid 2, enters through the vertical channel. The other fluid, Fluid 1, flows from the right to left through the horizontal channel.
Figure 1: The modeling domain of the T-junction.
The problem described is straightforward to set up with the Laminar Two-Phase Flow, Level Set multiphysics coupling feature. The coupling couples the Laminar Flow and Level Set physics interfaces.
The Laminar Flow interface sets up a momentum transport equation and a continuity equation. The Level Set interface sets up a level set equation for the level set variable. The fluid interface is defined by the 0.5 contour of the level set function.
The Laminar Flow and Level Set interfaces use the following equations:
In the equations above, ρ denotes density (kg/m3), u velocity (m/s), t time (s), μ dynamic viscosity (Pa·s), p pressure (Pa), and Fst the surface tension force (N/m3). Furthermore, is the level set function, and γ and ε are numerical stabilization parameters.
The multiphysics coupling feature defines the density and viscosity according to
where ρ1, ρ2, μ1, and μ2 are the densities and viscosities of Fluid 1 and Fluid 2. Other definitions of the viscosity and pressure are also available.
Physical Parameters
The two liquids have the following physical properties:
The surface tension coefficient is 5·103 N/m.
Boundary Conditions
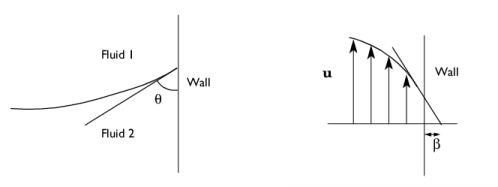
At both inlets, Fully developed flow conditions with prescribed volume flows are used. At the outflow boundary, the Pressure condition is set. The Wetted wall multiphysics boundary condition applies to all solid boundaries with the contact angle specified as 135° and a slip length equal 6.5e-5 m. The contact angle is the angle between the fluid interface and the solid wall at points where the fluid interface attaches to the wall. The slip length is the distance to the position outside the wall where the extrapolated tangential velocity component is zero (see Figure 2).
Figure 2: The contact angle, θ, and the slip length, β.
Results and Discussion
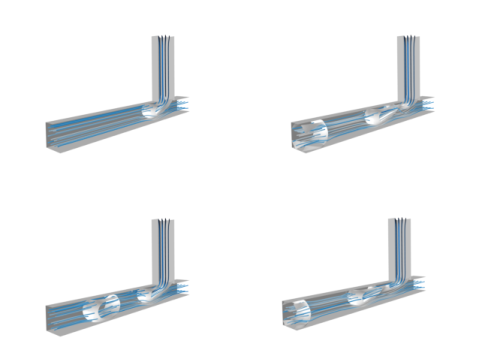
Figure 3 shows the fluid interface (the level set function ) and velocity streamlines at various times. The first droplet is formed after approximately 0.03 s.
Figure 3: Velocity streamlines and the phase boundary at t = 0.02 s, 0.04 s, 0.06 s, and 0.08 s.
You can calculate the effective diameter, deff — that is, the diameter of a spherical droplet with the same volume as the formed droplet — using the following expression:
(1)
Here, Ω represents the leftmost part of the horizontal channel, where x < −0.2 mm. In this case, the results show that deff is about 0.12 mm. The results are in fair agreement with those presented in Ref. 1.
Notes About the COMSOL Implementation
In time dependent problems it is important to respect the CFL condition (Courant-Friedrichs-Lewy condition) to ensure accuracy and stability, namely
where C is the Courant number. Since we are using an implicit method, we can work with a Courant number around 1 and use a constant time step of 6.510-4 s.
Reference
1. S. van der Graaf, T. Nisisako, C.G.P.H. Schroën, R.G.M. van der Sman, and R.M. Boom, “Lattice Boltzmann Simulations of Droplet Formation in a T-Shaped Microchannel,” Langmuir, vol. 22, pp. 4144–4152, 2006.
Application Library path: Microfluidics_Module/Two-Phase_Flow/droplet_breakup
Modeling Instructions
From the File menu, choose New.
New
In the New window, click  Model Wizard.
Model Wizard
1
In the Model Wizard window, click  3D.
2
In the Select Physics tree, select Fluid Flow>Multiphase Flow>Two-Phase Flow, Level Set>Laminar Flow.
3
Click Add.
4
Click  Study.
5
In the Select Study tree, select Preset Studies for Selected Multiphysics>Time Dependent with Phase Initialization.
6
Geometry 1
1
In the Model Builder window, under Component 1 (comp1) click Geometry 1.
2
In the Settings window for Geometry, locate the Units section.
3
From the Length unit list, choose mm.
Work Plane 1 (wp1)
1
In the Geometry toolbar, click  Work Plane.
2
In the Settings window for Work Plane, locate the Plane Definition section.
3
From the Plane list, choose xz-plane.
4
Click  Show Work Plane.
Work Plane 1 (wp1)>Rectangle 1 (r1)
1
In the Work Plane toolbar, click  Rectangle.
2
In the Settings window for Rectangle, locate the Size and Shape section.
3
In the Width text field, type 0.1.
4
In the Height text field, type 0.4.
5
Locate the Position section. In the yw text field, type 0.1.
Work Plane 1 (wp1)>Rectangle 2 (r2)
1
In the Work Plane toolbar, click  Rectangle.
2
In the Settings window for Rectangle, locate the Size and Shape section.
3
In the Height text field, type 0.1.
4
Locate the Position section. In the xw text field, type -0.7.
Work Plane 1 (wp1)>Plane Geometry
1
In the Work Plane toolbar, click  Build All.
2
Click the  Zoom Extents button in the Graphics toolbar.
Work Plane 1 (wp1)>Polygon 1 (pol1)
1
In the Work Plane toolbar, click  Polygon.
2
In the Settings window for Polygon, locate the Object Type section.
3
From the Type list, choose Open curve.
4
Locate the Coordinates section. In the table, enter the following settings:
5
Click  Build Selected.
Work Plane 1 (wp1)>Polygon 2 (pol2)
1
In the Work Plane toolbar, click  Polygon.
2
In the Settings window for Polygon, locate the Coordinates section.
3
4
Click  Build Selected.
Extrude 1 (ext1)
1
In the Model Builder window, under Component 1 (comp1)>Geometry 1 right-click Work Plane 1 (wp1) and choose Extrude.
2
In the Settings window for Extrude, locate the Distances section.
3
4
Click  Build Selected.
5
Click the  Zoom Extents button in the Graphics toolbar.
Form Union (fin)
1
In the Model Builder window, right-click Form Union (fin) and choose Build Selected.
The geometry should look like in Figure 1.
Materials
Fluid 1
1
In the Model Builder window, under Component 1 (comp1) right-click Materials and choose Blank Material.
2
Right-click Material 1 (mat1) and choose Rename.
3
In the Rename Material dialog box, type Fluid 1 in the New label text field.
4
5
In the Settings window for Material, locate the Material Contents section.
6
Fluid 2
1
In the Model Builder window, right-click Materials and choose Blank Material.
2
Right-click Material 2 (mat2) and choose Rename.
3
In the Rename Material dialog box, type Fluid 2 in the New label text field.
4
5
In the Settings window for Material, click to expand the Material Properties section.
6
In the Material properties tree, select Basic Properties>Density.
7
Click  Add to Material.
8
In the Material properties tree, select Basic Properties>Dynamic Viscosity.
9
Click  Add to Material.
10
Locate the Material Contents section. In the table, enter the following settings:
Definitions
Step 1 (step1)
1
In the Home toolbar, click  Functions and choose Local>Step.
2
In the Settings window for Step, locate the Parameters section.
3
In the Location text field, type 1e-3.
4
Click to expand the Smoothing section. In the Size of transition zone text field, type 2e-3.
Integration 1 (intop1)
Add a nonlocal integration coupling that you will use to calculate the effective droplet diameter according to Equation 1 in the Model Definition section.
1
In the Definitions toolbar, click  Nonlocal Couplings and choose Integration.
2
In the Settings window for Integration, locate the Source Selection section.
3
From the Selection list, choose All domains.
Variables 1
1
In the Definitions toolbar, click  Local Variables.
2
In the Settings window for Variables, locate the Variables section.
3
Multiphysics
Two-Phase Flow, Level Set 1 (tpf1)
1
In the Model Builder window, under Component 1 (comp1)>Multiphysics click Two-Phase Flow, Level Set 1 (tpf1).
2
In the Settings window for Two-Phase Flow, Level Set, locate the Fluid 1 Properties section.
3
From the Fluid 1 list, choose Fluid 1 (mat1).
4
Locate the Fluid 2 Properties section. From the Fluid 2 list, choose Fluid 2 (mat2).
5
Locate the Surface Tension section. Select the Include surface tension force in momentum equation check box.
6
From the Surface tension coefficient list, choose User defined. In the σ text field, type 5e-3[N/m].
Level Set (ls)
Level Set Model 1
1
In the Model Builder window, under Component 1 (comp1)>Level Set (ls) click Level Set Model 1.
2
In the Settings window for Level Set Model, locate the Level Set Model section.
3
In the γ text field, type 0.1[m/s].
4
In the εls text field, type 5e-6.
Multiphysics
Wetted Wall 1 (ww1)
1
In the Physics toolbar, click  Multiphysics Couplings and choose Boundary>Wetted Wall.
2
3
In the Settings window for Wetted Wall, locate the Wetted Wall section.
4
From the Slip length list, choose User defined. In the β text field, type 5e-6[m].
5
In the θw text field, type 3*pi/4[rad].
Level Set (ls)
Initial Values, Fluid 2 1
1
In the Model Builder window, under Component 1 (comp1)>Level Set (ls) click Initial Values, Fluid 2 1.
2
For Domains 1, 2 and 4, the default initial value settings apply.
Laminar Flow (spf)
In the Model Builder window, under Component 1 (comp1) click Laminar Flow (spf).
Inlet 1
1
In the Physics toolbar, click  Boundaries and choose Inlet.
2
3
In the Settings window for Inlet, locate the Boundary Condition section.
4
From the list, choose Fully developed flow.
5
Locate the Fully Developed Flow section. Click the Flow rate button.
6
In the V0 text field, type V1.
Inlet 2
1
In the Physics toolbar, click  Boundaries and choose Inlet.
2
3
In the Settings window for Inlet, locate the Boundary Condition section.
4
From the list, choose Fully developed flow.
5
Locate the Fully Developed Flow section. Click the Flow rate button.
6
In the V0 text field, type V2.
Outlet 1
1
In the Physics toolbar, click  Boundaries and choose Outlet.
2
Symmetry 1
1
In the Physics toolbar, click  Boundaries and choose Symmetry.
2
Level Set (ls)
In the Model Builder window, under Component 1 (comp1) click Level Set (ls).
Inlet 1
1
In the Physics toolbar, click  Boundaries and choose Inlet.
2
3
In the Settings window for Inlet, locate the Level Set Condition section.
4
From the list, choose Fluid 2 (ϕ = 1).
Inlet 2
1
In the Physics toolbar, click  Boundaries and choose Inlet.
2
Click the  Zoom Extents button in the Graphics toolbar.
3
Outlet 1
1
In the Physics toolbar, click  Boundaries and choose Outlet.
2
Symmetry 1
1
In the Physics toolbar, click  Boundaries and choose Symmetry.
2
Mesh 1
Mapped 1
1
In the Model Builder window, under Component 1 (comp1) right-click Mesh 1 and choose More Operations>Mapped.
2
Distribution 1
1
Right-click Mapped 1 and choose Distribution.
2
3
In the Settings window for Distribution, locate the Distribution section.
4
In the Number of elements text field, type 160.
Distribution 2
1
In the Model Builder window, right-click Mapped 1 and choose Distribution.
2
3
In the Settings window for Distribution, locate the Distribution section.
4
In the Number of elements text field, type 20.
Distribution 3
1
Right-click Mapped 1 and choose Distribution.
2
3
In the Settings window for Distribution, locate the Distribution section.
4
From the Distribution type list, choose Predefined.
5
In the Number of elements text field, type 25.
6
In the Element ratio text field, type 4.
Distribution 4
1
Right-click Mapped 1 and choose Distribution.
2
3
In the Settings window for Distribution, locate the Distribution section.
4
From the Distribution type list, choose Predefined.
5
In the Number of elements text field, type 20.
6
In the Element ratio text field, type 3.
7
Select the Reverse direction check box.
Mapped 1
Right-click Mapped 1 and choose Build Selected.
Swept 1
1
In the Model Builder window, right-click Mesh 1 and choose Swept.
2
In the Settings window for Swept, click to expand the Source Faces section.
3
Distribution 1
1
Right-click Swept 1 and choose Distribution.
2
In the Settings window for Distribution, locate the Distribution section.
3
In the Number of elements text field, type 10.
4
Click  Build All.
Study 1
Step 2: Time Dependent
1
In the Model Builder window, under Study 1 click Step 2: Time Dependent.
2
In the Settings window for Time Dependent, locate the Study Settings section.
3
In the Output times text field, type range(0,2.5e-3,0.08).
4
Click to expand the Results While Solving section. Select the Plot check box.
This choice means that the Graphics window will show a surface plot of the volume fraction of Fluid 1 while solving, and this plot will be updated at each output time step.
Solution 1 (sol1)
Manually tune the solver sequence for optimal performance and accuracy.
1
In the Study toolbar, click  Show Default Solver.
2
In the Model Builder window, expand the Solution 1 (sol1) node.
3
In the Model Builder window, expand the Study 1>Solver Configurations>Solution 1 (sol1)>Dependent Variables 2 node, then click Velocity field (comp1.u).
4
In the Settings window for Field, locate the Scaling section.
5
From the Method list, choose Manual.
6
In the Scale text field, type 0.1.
7
In the Model Builder window, click Time-Dependent Solver 1.
8
In the Settings window for Time-Dependent Solver, click to expand the Time Stepping section.
9
From the Method list, choose Generalized alpha.
10
From the Steps taken by solver list, choose Manual.
11
In the Time step text field, type 6.5e-5.
12
Find the Algebraic variable settings subsection. In the Fraction of initial step for Backward Euler text field, type 1.
13
In the Study toolbar, click  Compute.
Results
Velocity (spf)
Click the  Zoom Extents button in the Graphics toolbar.
Isosurface 1
1
Right-click Velocity (spf) and choose Isosurface.
2
In the Settings window for Isosurface, locate the Expression section.
3
In the Expression text field, type ls.Vf1.
4
Locate the Levels section. From the Entry method list, choose Levels.
5
In the Levels text field, type 0.5.
6
Locate the Coloring and Style section. From the Coloring list, choose Uniform.
7
From the Color list, choose Gray.
8
In the Velocity (spf) toolbar, click  Plot.
Volume Fraction
1
In the Model Builder window, click Pressure (spf).
2
In the Settings window for 3D Plot Group, locate the Data section.
3
From the Dataset list, choose Study 1/Solution 1 (sol1).
4
Right-click Pressure (spf) and choose Rename.
5
In the Rename 3D Plot Group dialog box, type Volume Fraction in the New label text field.
6
Slice 1
1
Right-click Volume Fraction and choose Slice.
2
In the Settings window for Slice, locate the Expression section.
3
In the Expression text field, type ls.Vf1.
Pressure
In the Model Builder window, right-click Pressure and choose Delete.
Surface
In the Model Builder window, right-click Surface and choose Delete.
Volume Fraction of Fluid 1 (ls)
Now, the first default plot group shows a slice plot of the velocity combined with a contour plot of the volume fraction of fluid 1, and the second plot group shows the volume fraction of fluid 1 as a slice plot. Follow these steps to reproduce the series of velocity field plots shown in Figure 3.
Slice 1
1
In the Model Builder window, expand the Volume Fraction of Fluid 1 (ls) node.
2
Right-click Slice 1 and choose Disable.
Isosurface 1
1
In the Model Builder window, click Isosurface 1.
2
In the Settings window for Isosurface, locate the Coloring and Style section.
3
From the Color list, choose White.
Isosurface 2
Right-click Results>Volume Fraction of Fluid 1 (ls)>Isosurface 1 and choose Duplicate.
Deformation 1
1
In the Model Builder window, right-click Isosurface 2 and choose Deformation.
2
In the Settings window for Deformation, locate the Expression section.
3
In the y component text field, type -2*y.
4
Locate the Scale section. Select the Scale factor check box.
5
Streamline 1
1
In the Model Builder window, right-click Volume Fraction of Fluid 1 (ls) and choose Streamline.
2
In the Settings window for Streamline, locate the Streamline Positioning section.
3
In the Number text field, type 8.
4
5
Locate the Coloring and Style section. Find the Line style subsection. From the Type list, choose Tube.
6
Select the Radius scale factor check box.
7
Color Expression 1
1
Right-click Streamline 1 and choose Color Expression.
2
In the Settings window for Color Expression, locate the Coloring and Style section.
3
From the Color table list, choose JupiterAuroraBorealis.
4
Clear the Color legend check box.
Streamline 2
In the Model Builder window, under Results>Volume Fraction of Fluid 1 (ls) right-click Streamline 1 and choose Duplicate.
Deformation 1
1
In the Model Builder window, right-click Streamline 2 and choose Deformation.
2
In the Settings window for Deformation, locate the Expression section.
3
In the y component text field, type -2*y.
4
Locate the Scale section. Select the Scale factor check box.
5
Surface 1
1
In the Model Builder window, right-click Volume Fraction of Fluid 1 (ls) and choose Surface.
2
In the Settings window for Surface, locate the Coloring and Style section.
3
From the Coloring list, choose Uniform.
4
From the Color list, choose Gray.
Selection 1
1
Right-click Surface 1 and choose Selection.
2
Surface 2
In the Model Builder window, under Results>Volume Fraction of Fluid 1 (ls) right-click Surface 1 and choose Duplicate.
Deformation 1
1
In the Model Builder window, expand the Surface 2 node.
2
Right-click Surface 2 and choose Deformation.
3
In the Settings window for Deformation, locate the Expression section.
4
In the y component text field, type 0.05.
5
Locate the Scale section. Select the Scale factor check box.
6
Selection 1
1
In the Model Builder window, click Selection 1.
2
In the Settings window for Selection, locate the Selection section.
3
Select the  Activate Selection toggle button.
4
Volume Fraction of Fluid 1 (ls)
1
In the Model Builder window, click Volume Fraction of Fluid 1 (ls).
2
In the Settings window for 3D Plot Group, locate the Data section.
3
From the Time (s) list, choose 0.02.
4
Locate the Plot Settings section. Clear the Plot dataset edges check box.
5
In the Volume Fraction of Fluid 1 (ls) toolbar, click  Plot.
6
Compare the resulting plot with the upper-left plot in Figure 3.To reproduce the remaining three plots, plot the solution for the time values 0.04, 0.06, and 0.08 s.
Global Evaluation 1
Next, evaluate the effective droplet diameter computed according to Equation 1.
1
In the Results toolbar, click  Global Evaluation.
2
In the Settings window for Global Evaluation, click Replace Expression in the upper-right corner of the Expressions section. From the menu, choose Component 1 (comp1)>Definitions>Variables>d_eff - Effective droplet diameter - m.
3
Click  Evaluate.
Table
1
Go to the Table window.
The result, roughly 0.12 mm, is displayed in the table in the Table window.
Results
Finally, generate a movie of the moving fluid interface and the velocity streamlines.
Volume Fraction of Fluid 1 (ls)
In the Model Builder window, under Results click Volume Fraction of Fluid 1 (ls).
Animation 1
1
In the Volume Fraction of Fluid 1 (ls) toolbar, click  Animation and choose Player.
COMSOL Multiphysics generates the movie. To play the movie, click the Play button in the Graphics toolbar. If you want to export a movie in GIF, Flash, or AVI format, select File from the Target list.