PDF

Hepatic Tumor Ablation
Introduction
One method for removing cancerous tumors from healthy tissue is to heat the malignant tissue to a critical temperature that kills the cancer cells. This example accomplishes the localized heating by inserting a four-armed electric probe through which an electric current runs. Equations for the electric field for this case appear in the Electric Currents interface, and this example couples them to the bioheat equation, which models the temperature field in the tissue. The heat source resulting from the electric field is also known as resistive heating or Joule heating. The original model comes from S. Tungjitkusolmun and others (Ref. 1), but we have made some simplifications. For instance, while the original uses RF heating (with AC currents), the COMSOL Multiphysics model approximates the energy with DC currents.
This medical procedure removes the tumorous tissue by heating it above 45 °C to 50 °C. Doing so requires a local heat source, which physicians create by inserting a small electric probe. The probe is made of a trocar (the main rod) and four electrode arms as shown in Figure 1. The trocar is electrically insulated except near the electrode arms.
An electric current through the probe creates an electric field in the tissue. The field is strongest in the immediate vicinity of the probe and generates resistive heating, which dominates around the probe’s electrode arms because of the strong electric field.
Figure 1: Cylindrical modeling domain with the four-armed electric probe in the middle, which is located next to a large blood vessel.
Model Definition
This tutorial uses the Bioheat Transfer interface, the Electric Currents interface and a multiphysics feature, Electromagnetic Heat Source, to implement a transient analysis.
The standard temperature unit in COMSOL Multiphysics is kelvin (K). This tutorial uses the Celsius temperature scale, which is more convenient for models involving the bioheat equation.
The model approximates the body tissue with a large cylinder and assumes that its boundary temperature remains at 37°C during the entire procedure. The tumor is located near the center of the cylinder and has the same thermal properties as the surrounding tissue. The model locates the probe along the cylinder’s centerline such that its electrodes span the region where the tumor is located. The geometry also includes a large blood vessel.
Heat Transfer
The bioheat equation governs heat transfer in the tissue
where δts is a time-scaling coefficient; ρ is the tissue density (kg/m3); C is the tissue’s specific heat (J/(kg·K)); and k is its thermal conductivity (W/(m·K)). On the right side of the equality, ρb gives the blood’s density (kg/m3); Cb is the blood’s specific heat (J/(kg·K)); ωb is its perfusion rate (1/s); Tb is the arterial blood temperature (Κ); while Qmet and Qext are the heat sources from metabolism and spatial heating, respectively (W/m3).
In this example, the bioheat equation also models heat transfer in various parts of the probe with the appropriate values for the specific heat, C (J/(kg·K)), and thermal conductivity, k (W/(m·K)). For these parts, all terms on the right-hand side are zero.
The model next sets the boundary conditions at the outer boundaries of the cylinder and at the walls of the blood vessel to a temperature of 37°C. Assume heat flux continuity on all other boundaries.
The initial temperature equals 37°C in all domains.
In addition to the heat transfer equation this model provides a calculation of the tissue damage integral. This gives an idea about the degree of tissue injury α during the process, based on the Arrhenius equation:
where A is the frequency factor (s-1) and ΔE is the activation energy for irreversible damage reaction (J/mol). These two parameters are dependent on the type of tissue. The fraction of necrotic tissue, θd, is then expressed by:
Electric Current
The governing equation for the Electric Currents interface is
where V is the potential (V), σ the electrical conductivity (S/m), Je an externally generated current density (A/m2), Qj the current source (A/m3).
In this model both Je and Qj are zero. The governing equation therefore simplifies into:
.
The boundary conditions at the cylinder’s outer boundaries is ground (0 V potential). At the electrode boundaries the potential equals 22 V. Assume continuity for all other boundaries.
The boundary conditions for the Electric Currents interface are:
The boundary conditions for the bioheat equation are:
The model solves the above equations with the given boundary conditions to obtain the temperature field as a function of time.
Results and Discussion
The model shows how the temperature increases with time in the tissue around the electrode.
The slice plot in Figure 2 illustrates the temperature field at the end of the procedure.
Figure 2: Temperature field at time 10 minutes.
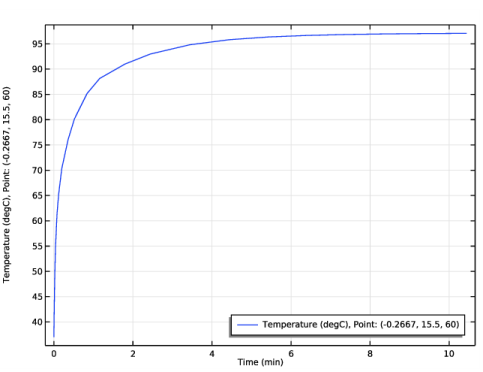
Figure 3 shows the temperature at the tip of one of the electrode arms. The temperature rises quickly until it reaches a steady-state temperature of about 97°C.
Figure 3: Temperature versus time at the tip of one of the electrode arms.
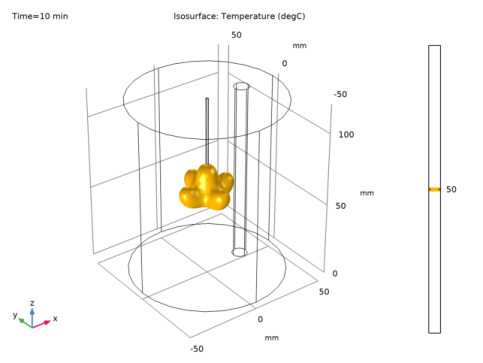
It is also interesting to visualize the region where cancer cells die, that is, where the temperature has reached at least 50°C. You can visualize this area with an isosurface for that temperature; Figure 4 shows one after 10 minutes.
Figure 4: Visualization of the region that has reached 50°C after 10 minutes.
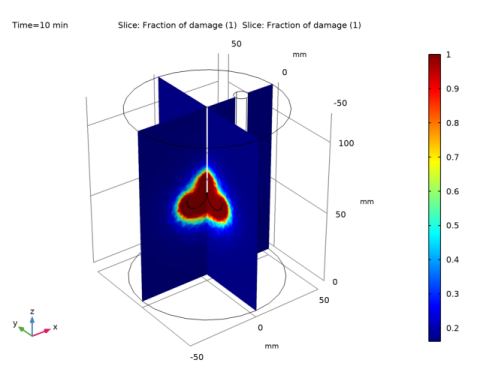
In addition to the previous figure, you can visualize the fraction of necrotic tissue in the slice plot of Figure 5.
Figure 5: Fraction of necrotic tissue.
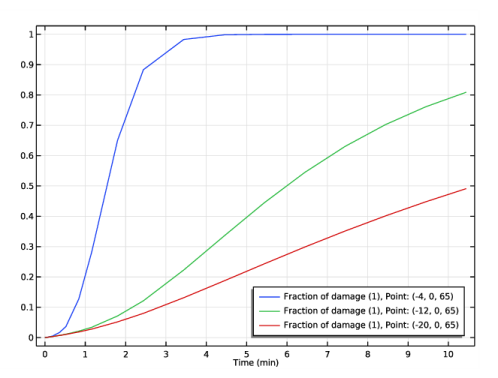
Finally, Figure 6 shows the fraction of necrotic tissue at three different points above the electrode arm. Observe that necrosis happens faster next to the electrode and the trocar tip.
Figure 6: Fraction of necrotic tissue at three points above the electrode arm.
Reference
1. S. Tungjitkusolmun, S. Tyler Staelin, D. Haemmerich, J.Z. Tsai, H. Cao, J.G. Webster, F.T. Lee, Jr., D.M. Mahvi, and V.R. Vorperian, “Three-Dimensional Finite Element Analyses for Radio-Frequency Hepatic Tumor Ablation,” IEEE Transactions on Biomedical Engineering, vol. 49, no. 1, 2002.
Application Library path: Heat_Transfer_Module/Medical_Technology/tumor_ablation
Modeling Instructions
From the File menu, choose New.
New
In the New window, click  Model Wizard.
Model Wizard
1
In the Model Wizard window, click  3D.
2
In the Select Physics tree, select AC/DC>Electric Fields and Currents>Electric Currents (ec).
3
Click Add.
4
In the Select Physics tree, select Heat Transfer>Bioheat Transfer (ht).
5
Click Add.
6
Click  Study.
7
In the Select Study tree, select General Studies>Time Dependent.
8
Global Definitions
First, define the global parameters of the model and the geometry.
Parameters 1
1
In the Model Builder window, under Global Definitions click Parameters 1.
2
In the Settings window for Parameters, locate the Parameters section.
3
Geometry 1
1
In the Model Builder window, under Component 1 (comp1) click Geometry 1.
2
In the Settings window for Geometry, locate the Units section.
3
From the Length unit list, choose mm.
Cylinder 1 (cyl1)
1
In the Geometry toolbar, click  Cylinder.
2
In the Settings window for Cylinder, locate the Size and Shape section.
3
In the Radius text field, type 0.9144.
4
In the Height text field, type 60.
5
Locate the Position section. In the z text field, type 60.
6
Click to expand the Layers section. In the table, enter the following settings:
7
Clear the Layers on side check box.
8
Select the Layers on bottom check box.
9
Click  Build Selected.
Torus 1 (tor1)
1
In the Geometry toolbar, click  Torus.
2
In the Settings window for Torus, locate the Size and Shape section.
3
In the Major radius text field, type 7.5.
4
In the Minor radius text field, type 0.2667.
5
In the Revolution angle text field, type 180.
6
Locate the Position section. In the x text field, type 8.
7
In the z text field, type 60.
8
Locate the Axis section. From the Axis type list, choose y-axis.
9
Locate the Rotation Angle section. In the Rotation text field, type -90.
10
Click  Build Selected.
Rotate 1 (rot1)
1
In the Geometry toolbar, click  Transforms and choose Rotate.
2
3
In the Settings window for Rotate, locate the Rotation section.
4
Click  Range.
5
In the Range dialog box, type 0 in the Start text field.
6
In the Step text field, type 90.
7
In the Stop text field, type 270.
8
Click Replace.
9
In the Settings window for Rotate, click  Build Selected.
10
Click the  Zoom Extents button in the Graphics toolbar.
Cylinder 2 (cyl2)
1
In the Geometry toolbar, click  Cylinder.
2
In the Settings window for Cylinder, locate the Size and Shape section.
3
In the Radius text field, type 5.
4
In the Height text field, type 120.
5
Locate the Position section. In the x text field, type xc_v.
6
Click  Build Selected.
7
Click the  Zoom Extents button in the Graphics toolbar.
Cylinder 3 (cyl3)
1
In the Geometry toolbar, click  Cylinder.
2
In the Settings window for Cylinder, locate the Size and Shape section.
3
In the Radius text field, type 50.
4
In the Height text field, type 120.
5
In the Geometry toolbar, click  Build All.
6
Click the  Zoom Extents button in the Graphics toolbar.
Definitions
Exterior Boundaries
1
In the Definitions toolbar, click  Explicit.
2
In the Settings window for Explicit, type Exterior Boundaries in the Label text field.
3
Locate the Input Entities section. Select the All domains check box.
4
Locate the Output Entities section. From the Output entities list, choose Adjacent boundaries.
Liver Tissue
1
In the Definitions toolbar, click  Explicit.
2
In the Settings window for Explicit, type Liver Tissue in the Label text field.
3
Blood Vessel
1
In the Definitions toolbar, click  Explicit.
2
In the Settings window for Explicit, type Blood Vessel in the Label text field.
3
Electrodes
1
In the Definitions toolbar, click  Explicit.
2
In the Settings window for Explicit, type Electrodes in the Label text field.
3
Click the  Wireframe Rendering button in the Graphics toolbar.
4
Trocar Tip
1
In the Definitions toolbar, click  Explicit.
2
In the Settings window for Explicit, type Trocar Tip in the Label text field.
3
Trocar Base
1
In the Definitions toolbar, click  Explicit.
2
In the Settings window for Explicit, type Trocar Base in the Label text field.
3
Trocar
1
In the Definitions toolbar, click  Union.
2
In the Settings window for Union, type Trocar in the Label text field.
3
Locate the Input Entities section. Under Selections to add, click  Add.
4
In the Add dialog box, in the Selections to add list, choose Electrodes, Trocar Tip, and Trocar Base.
5
Tissue and Trocar
1
In the Definitions toolbar, click  Union.
2
In the Settings window for Union, type Tissue and Trocar in the Label text field.
3
Locate the Input Entities section. Under Selections to add, click  Add.
4
In the Add dialog box, in the Selections to add list, choose Liver Tissue and Trocar.
5
Tissue and Trocar, Exterior Boundaries
1
In the Definitions toolbar, click  Adjacent.
2
In the Settings window for Adjacent, type Tissue and Trocar, Exterior Boundaries in the Label text field.
3
Locate the Input Entities section. Under Input selections, click  Add.
4
In the Add dialog box, select Tissue and Trocar in the Input selections list.
5
Trocar Tip and Electrodes, Exterior Boundaries
1
In the Definitions toolbar, click  Adjacent.
2
In the Settings window for Adjacent, type Trocar Tip and Electrodes, Exterior Boundaries in the Label text field.
3
Locate the Input Entities section. Under Input selections, click  Add.
4
In the Add dialog box, in the Input selections list, choose Electrodes and Trocar Tip.
5
Add Material
1
In the Home toolbar, click  Add Material to open the Add Material window.
2
Go to the Add Material window.
3
In the tree, select Bioheat>Liver (human).
4
Click Add to Component in the window toolbar.
5
In the Home toolbar, click  Add Material to close the Add Material window.
Materials
Liver (human) (mat1)
1
In the Settings window for Material, locate the Geometric Entity Selection section.
2
From the Selection list, choose Liver Tissue.
3
Locate the Material Contents section. In the table, enter the following settings:
Blood
1
In the Materials toolbar, click  Blank Material.
2
In the Settings window for Material, type Blood in the Label text field.
3
Locate the Geometric Entity Selection section. From the Selection list, choose Blood Vessel.
4
Locate the Material Contents section. In the table, enter the following settings:
Electrodes
1
In the Materials toolbar, click  Blank Material.
2
In the Settings window for Material, type Electrodes in the Label text field.
3
Locate the Geometric Entity Selection section. From the Selection list, choose Electrodes.
4
Locate the Material Contents section. In the table, enter the following settings:
Trocar Tip
1
In the Materials toolbar, click  Blank Material.
2
In the Settings window for Material, type Trocar Tip in the Label text field.
3
Locate the Geometric Entity Selection section. From the Selection list, choose Trocar Tip.
4
Locate the Material Contents section. In the table, enter the following settings:
Trocar Base
1
In the Materials toolbar, click  Blank Material.
2
In the Settings window for Material, type Trocar Base in the Label text field.
3
Locate the Geometric Entity Selection section. From the Selection list, choose Trocar Base.
4
Locate the Material Contents section. In the table, enter the following settings:
Electric Currents (ec)
At the time scale of the tumor ablation process, the electric field is stationary. Change the equation form accordingly.
1
In the Model Builder window, under Component 1 (comp1) click Electric Currents (ec).
2
In the Settings window for Electric Currents, click to expand the Equation section.
3
From the Equation form list, choose Stationary.
To reduce the size of the computation problem, select a lower element order.
4
Click to expand the Discretization section. From the Electric potential list, choose Linear.
Ground 1
1
In the Physics toolbar, click  Boundaries and choose Ground.
2
In the Settings window for Ground, locate the Boundary Selection section.
3
From the Selection list, choose Exterior Boundaries.
Electric Potential 1
1
In the Physics toolbar, click  Boundaries and choose Electric Potential.
2
In the Settings window for Electric Potential, locate the Boundary Selection section.
3
From the Selection list, choose Trocar Tip and Electrodes, Exterior Boundaries.
4
Locate the Electric Potential section. In the V0 text field, type V0.
Bioheat Transfer (ht)
1
In the Model Builder window, under Component 1 (comp1) click Bioheat Transfer (ht).
2
In the Settings window for Bioheat Transfer, locate the Domain Selection section.
3
From the Selection list, choose Tissue and Trocar.
Biological Tissue 1
In the Model Builder window, under Component 1 (comp1)>Bioheat Transfer (ht) click Biological Tissue 1.
Thermal Damage 1
1
In the Physics toolbar, click  Attributes and choose Thermal Damage.
2
In the Settings window for Thermal Damage, locate the Damaged Tissue section.
3
From the Transformation model list, choose Arrhenius kinetics.
Bioheat 1
1
In the Model Builder window, click Bioheat 1.
2
In the Settings window for Bioheat, locate the Bioheat section.
3
In the Tb text field, type T_b.
4
In the Cp,b text field, type c_b.
5
In the ωb text field, type omega_b.
6
In the ρb text field, type rho_b.
Initial Values 1
1
In the Model Builder window, click Initial Values 1.
2
In the Settings window for Initial Values, locate the Initial Values section.
3
In the T text field, type T0.
Solid 1
1
In the Physics toolbar, click  Domains and choose Solid.
2
In the Settings window for Solid, locate the Domain Selection section.
3
From the Selection list, choose Trocar.
Temperature 1
1
In the Physics toolbar, click  Boundaries and choose Temperature.
2
In the Settings window for Temperature, locate the Boundary Selection section.
3
From the Selection list, choose Tissue and Trocar, Exterior Boundaries.
4
Locate the Temperature section. In the T0 text field, type T_b.
Multiphysics
Electromagnetic Heating 1 (emh1)
In the Physics toolbar, click  Multiphysics Couplings and choose Domain>Electromagnetic Heating.
Mesh 1
Free Tetrahedral 1
In the Mesh toolbar, click  Free Tetrahedral.
Size 1
1
Right-click Free Tetrahedral 1 and choose Size.
2
In the Settings window for Size, locate the Geometric Entity Selection section.
3
From the Geometric entity level list, choose Domain.
4
5
Locate the Element Size section. Click the Custom button.
6
Locate the Element Size Parameters section. Select the Maximum element size check box.
7
8
Select the Minimum element size check box.
9
Size 2
1
In the Model Builder window, right-click Free Tetrahedral 1 and choose Size.
2
In the Settings window for Size, locate the Geometric Entity Selection section.
3
From the Geometric entity level list, choose Domain.
4
5
Locate the Element Size section. Click the Custom button.
6
Locate the Element Size Parameters section. Select the Maximum element size check box.
7
8
Select the Minimum element size check box.
9
Size
1
In the Model Builder window, click Size.
2
In the Settings window for Size, locate the Element Size section.
3
Click the Custom button.
4
Locate the Element Size Parameters section. In the Resolution of narrow regions text field, type 0.
5
Click  Build All.
Study 1
Step 1: Time Dependent
1
In the Model Builder window, under Study 1 click Step 1: Time Dependent.
2
In the Settings window for Time Dependent, locate the Study Settings section.
3
From the Time unit list, choose min.
4
In the Output times text field, type range(0,a_time/4,a_time).
Add probes to save the fraction of necrotic tissue and the temperature over time at some specified points.
Definitions
Domain Point Probe 1
1
In the Definitions toolbar, click  Probes and choose Domain Point Probe.
2
In the Settings window for Domain Point Probe, locate the Point Selection section.
3
In row Coordinates, set x to -4.
4
In row Coordinates, set z to 65.
Point Probe Expression 1 (ppb1)
1
In the Model Builder window, expand the Domain Point Probe 1 node, then click Point Probe Expression 1 (ppb1).
2
In the Settings window for Point Probe Expression, click Replace Expression in the upper-right corner of the Expression section. From the menu, choose Component 1 (comp1)>Bioheat Transfer>Irreversible transformation>ht.theta_d - Fraction of damage.
3
Click to expand the Table and Window Settings section. Click  Add Plot Window.
Domain Point Probe 2
1
In the Model Builder window, under Component 1 (comp1)>Definitions right-click Domain Point Probe 1 and choose Duplicate.
2
In the Settings window for Domain Point Probe, locate the Point Selection section.
3
In row Coordinates, set x to -12.
Domain Point Probe 3
1
Right-click Domain Point Probe 1 and choose Duplicate.
2
In the Settings window for Domain Point Probe, locate the Point Selection section.
3
In row Coordinates, set x to -20.
Domain Point Probe 4
1
In the Definitions toolbar, click  Probes and choose Domain Point Probe.
2
In the Settings window for Domain Point Probe, locate the Point Selection section.
3
In row Coordinates, set x to -0.2667.
4
In row Coordinates, set y to 15.5.
5
In row Coordinates, set z to 60.
Point Probe Expression 4 (ppb4)
1
In the Model Builder window, expand the Domain Point Probe 4 node, then click Point Probe Expression 4 (ppb4).
2
In the Settings window for Point Probe Expression, click Replace Expression in the upper-right corner of the Expression section. From the menu, choose Component 1 (comp1)>Bioheat Transfer>Temperature>T - Temperature - K.
3
Locate the Table and Window Settings section. Click  Add Plot Window.
4
Locate the Expression section. From the Table and plot unit list, choose degC.
Study 1
In the Home toolbar, click  Compute.
Results
Electric Potential (ec)
The first default plot shows the electric potential on slices.
Temperature (ht)
The second default plot shows the temperature at the final time.
To reproduce the two-slice plot of the temperature at 10 minutes shown in Figure 2, proceed as follows.
Before adding slices, delete the default Surface node.
Surface
1
In the Model Builder window, expand the Temperature (ht) node.
2
Right-click Surface and choose Delete. Click Yes to confirm.
Temperature (ht)
In the Model Builder window, click Temperature (ht).
Slice 1
1
In the Temperature (ht) toolbar, click  Slice.
2
In the Settings window for Slice, click Replace Expression in the upper-right corner of the Expression section. From the menu, choose Component 1 (comp1)>Bioheat Transfer>Temperature>T - Temperature - K.
3
Locate the Expression section. From the Unit list, choose degC.
4
Locate the Plane Data section. In the Planes text field, type 1.
5
Locate the Coloring and Style section. From the Color table list, choose ThermalLight.
Temperature (ht)
In the Model Builder window, click Temperature (ht).
Slice 2
1
In the Temperature (ht) toolbar, click  Slice.
2
In the Settings window for Slice, click Replace Expression in the upper-right corner of the Expression section. From the menu, choose Component 1 (comp1)>Bioheat Transfer>Temperature>T - Temperature - K.
3
Locate the Expression section. From the Unit list, choose degC.
4
Locate the Plane Data section. From the Plane list, choose ZX-planes.
5
In the Planes text field, type 1.
6
Locate the Coloring and Style section. From the Color table list, choose ThermalLight.
7
Click to expand the Inherit Style section. From the Plot list, choose Slice 1.
8
In the Temperature (ht) toolbar, click  Plot.
9
Click the  Zoom In button in the Graphics toolbar.
Isothermal Contours (ht)
The third default plot shows isothermal contours for the final time.
To reproduce Figure 4, modify this plot group as follows:
Isosurface
1
In the Model Builder window, expand the Isothermal Contours (ht) node, then click Isosurface.
2
In the Settings window for Isosurface, locate the Expression section.
3
From the Unit list, choose degC.
4
Locate the Levels section. From the Entry method list, choose Levels.
5
In the Levels text field, type 50.
Isothermal Contours (ht)
1
In the Model Builder window, click Isothermal Contours (ht).
2
In the Isothermal Contours (ht) toolbar, click  Plot.
Damaged Tissue, 1D
1
In the Model Builder window, under Results click Probe Plot Group 4.
2
In the Settings window for 1D Plot Group, type Damaged Tissue, 1D in the Label text field.
3
Locate the Legend section. From the Position list, choose Lower right.
4
In the Damaged Tissue, 1D toolbar, click  Plot.
Generate plots to show the fraction of necrotic tissue.
Temperature at One Electrode Tip
1
In the Model Builder window, under Results click Probe Plot Group 5.
2
In the Settings window for 1D Plot Group, type Temperature at One Electrode Tip in the Label text field.
3
Locate the Legend section. From the Position list, choose Lower right.
4
In the Temperature at One Electrode Tip toolbar, click  Plot.
Damaged Tissue, 3D
1
In the Home toolbar, click  Add Plot Group and choose 3D Plot Group.
2
In the Settings window for 3D Plot Group, type Damaged Tissue, 3D in the Label text field.
Slice 1
1
In the Damaged Tissue, 3D toolbar, click  Slice.
2
In the Settings window for Slice, click Replace Expression in the upper-right corner of the Expression section. From the menu, choose Component 1 (comp1)>Bioheat Transfer>Irreversible transformation>ht.theta_d - Fraction of damage.
3
Locate the Plane Data section. In the Planes text field, type 1.
Slice 2
1
Right-click Slice 1 and choose Duplicate.
2
In the Settings window for Slice, locate the Plane Data section.
3
From the Plane list, choose ZX-planes.
4
In the Planes text field, type 1.
5
Locate the Inherit Style section. From the Plot list, choose Slice 1.
6
In the Damaged Tissue, 3D toolbar, click  Plot.