PDF

Thermal Bridges in Building Construction — 3D Structure Between Two Floors
Introduction
The European standard EN ISO 10211:2007 for thermal bridges in building constructions provides four test cases — two 2D and two 3D — for validating a numerical method (Ref. 1). If the values obtained by a method conform to the results of all these four cases, the method is classified as a three-dimensional steady-state high precision method.
COMSOL Multiphysics successfully passes all the test cases described by the standard and is hence classified as a three-dimensional steady-state high precision method. This document presents an implementation of the first 3D model (Case 3).
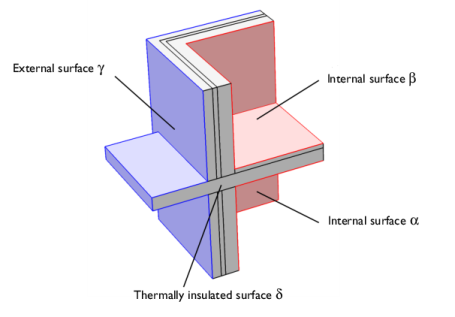
Figure 1: Geometry and boundary conditions of ISO 10211:2007 test case 3.
This tutorial studies the heat conduction in a building structure separating two floors from the external environment. The structure’s surfaces are divided into four parts:
The values of interest for validation are the lowest temperatures at surfaces α and β, and the heat fluxes through α, β, and γ.
Model Definition
Figure 1 illustrates the geometry. The external surface is at 0°C and the interior surface is at 20°C. Four materials with distinct thermal conductivities k are used in the structure. The horizontal block separating the two floors has the highest thermal conductivity (2.5 W/(m·K)). It crosses the wall, thereby creating a thermal bridge in the structure.
The surfaces α, β, and γ are subject to convective heat flux. The ISO 10211:2007 standard specifies the values of the thermal resistance, R, which is related to the heat transfer coefficient, h, according to
Results and Discussion
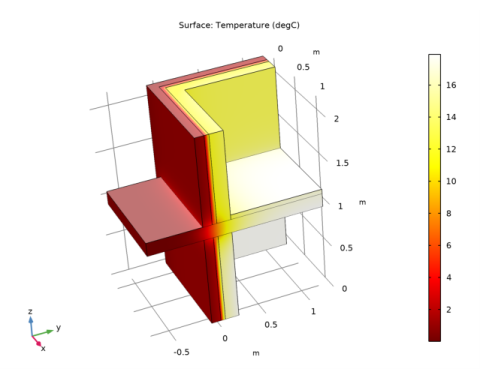
Figure 2 shows the temperature profile. The heat losses are greater near the thermal bridge formed by the horizontal block that crosses the wall.
Figure 2: Temperature distribution of ISO 10211:2007 test case 3.
The numerical results of COMSOL Multiphysics are compared with the expected values provided by ISO 10211:2007 (Ref. 1) in Table 1.
The maximum permissible differences to pass this test case are 0.1°C for temperature and 1% for heat flux. The measured values are completely consistent and meet the validation criteria. Note that they may change slightly depending on geometry representation and operating system.
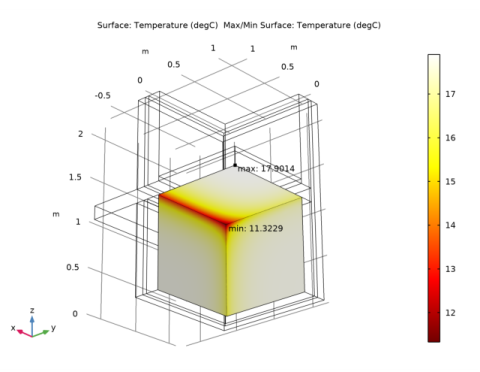
As shown in Figure 3 and Figure 4, the minimum temperature of the surfaces α and β are located at their respective corners.
Figure 3: Minimum and maximum temperatures on surface α, ISO 10211:2007 test case 3.
Figure 4: Minimum and maximum temperatures on surface β, ISO 10211:2007 test case 3.
Reference
1. European Committee for Standardization, EN ISO 10211, Thermal bridges in building construction – Heat flows and surface temperatures – Detailed calculations (ISO 10211:2007), Appendix A, pp. 30–36, 2007.
Application Library path: Heat_Transfer_Module/Buildings_and_Constructions/thermal_bridge_3d_two_floors
Modeling Instructions
From the File menu, choose New.
New
In the New window, click  Model Wizard.
Model Wizard
1
In the Model Wizard window, click  3D.
2
In the Select Physics tree, select Heat Transfer>Heat Transfer in Solids (ht).
3
Click Add.
4
Click  Study.
5
In the Select Study tree, select General Studies>Stationary.
6
Global Definitions
Define the geometrical parameters.
Parameters 1
1
In the Model Builder window, under Global Definitions click Parameters 1.
2
In the Settings window for Parameters, locate the Parameters section.
3
Geometry 1
To build the walls separating the external and internal surfaces, create the cross section geometry and extrude it.
Work Plane 1 (wp1)
1
In the Geometry toolbar, click  Work Plane.
2
In the Settings window for Work Plane, click  Show Work Plane.
Work Plane 1 (wp1)>Plane Geometry
1
In the Model Builder window, click Plane Geometry.
The first two rectangles below correspond to the insulation layer of the wall.
Work Plane 1 (wp1)>Rectangle 1 (r1)
1
In the Work Plane toolbar, click  Rectangle.
2
In the Settings window for Rectangle, locate the Size and Shape section.
3
In the Width text field, type rect1.
4
In the Height text field, type wall_t1.
5
Click  Build Selected.
Work Plane 1 (wp1)>Rectangle 2 (r2)
1
In the Work Plane toolbar, click  Rectangle.
2
In the Settings window for Rectangle, locate the Size and Shape section.
3
In the Width text field, type wall_t1.
4
In the Height text field, type rect1.
5
Click  Build Selected.
6
Click the  Zoom Extents button in the Graphics toolbar.
Work Plane 1 (wp1)>Union 1 (uni1)
1
In the Work Plane toolbar, click  Booleans and Partitions and choose Union.
2
Click in the Graphics window and then press Ctrl+A to select both objects.
3
In the Settings window for Union, locate the Union section.
4
Clear the Keep interior boundaries check box.
5
Click  Build Selected.
Work Plane 1 (wp1)>Plane Geometry
Build the remaining layers of the walls in a similar manner.
Work Plane 1 (wp1)>Rectangle 3 (r3)
1
In the Work Plane toolbar, click  Rectangle.
2
In the Settings window for Rectangle, locate the Size and Shape section.
3
In the Width text field, type rect2.
4
In the Height text field, type wall_t2.
5
Locate the Position section. In the xw text field, type rect_shift.
6
In the yw text field, type rect_shift.
7
Click  Build Selected.
Work Plane 1 (wp1)>Rectangle 4 (r4)
1
In the Work Plane toolbar, click  Rectangle.
2
In the Settings window for Rectangle, locate the Size and Shape section.
3
In the Width text field, type wall_t2.
4
In the Height text field, type rect2.
5
Locate the Position section. In the xw text field, type rect_shift.
6
In the yw text field, type rect_shift.
7
Click  Build Selected.
Work Plane 1 (wp1)>Union 2 (uni2)
1
In the Work Plane toolbar, click  Booleans and Partitions and choose Union.
2
Select the objects r3 and r4 only.
3
In the Settings window for Union, locate the Union section.
4
Clear the Keep interior boundaries check box.
5
Click  Build Selected.
Extrude 1 (ext1)
1
In the Model Builder window, right-click Geometry 1 and choose Extrude.
2
In the Settings window for Extrude, locate the Distances section.
3
4
Click  Build Selected.
5
Click the  Zoom Extents button in the Graphics toolbar.
Block 1 (blk1)
1
In the Geometry toolbar, click  Block.
This block separates the two floors of the structure.
2
In the Settings window for Block, locate the Size and Shape section.
3
In the Width text field, type blk_w.
4
In the Depth text field, type blk_d.
5
In the Height text field, type blk_h.
6
Locate the Position section. In the x text field, type blk_shiftx.
7
In the y text field, type blk_shifty.
8
In the z text field, type blk_shiftz.
9
Click  Build Selected.
To remove unnecessary edges, you need to remove the parts of the walls that intersect this block. To do so, use the boolean operation Difference to subtract a copy of the block from the walls. Begin by creating the copy.
Block 2 (blk2)
Right-click Block 1 (blk1) and choose Duplicate.
Difference 1 (dif1)
1
In the Geometry toolbar, click  Booleans and Partitions and choose Difference.
2
The object labeled ext1 is made up of the walls previously obtained by extrusion.
3
In the Settings window for Difference, locate the Difference section.
4
Find the Objects to subtract subsection. Select the  Activate Selection toggle button.
5
6
Click  Build Selected.
Block 3 (blk3)
1
In the Geometry toolbar, click  Block.
This block corresponds to the floor of the inside upper level.
2
In the Settings window for Block, locate the Size and Shape section.
3
In the Width text field, type sq_l.
4
In the Depth text field, type sq_l.
5
In the Height text field, type sq_h.
6
Locate the Position section. In the x text field, type sq_shift.
7
In the y text field, type sq_shift.
8
In the z text field, type blk_shiftz+blk_h.
9
Click  Build Selected.
Ignore Edges 1 (ige1)
1
In the Geometry toolbar, click  Virtual Operations and choose Ignore Edges.
In the first steps of the geometry sequence, six unused vertical edges were created on the walls. They are responsible for unnecessary constraints on the mesh and they generate extra boundaries by splitting some faces. For these reasons, follow the instructions below to remove them.
2
On the object fin, select Edges 6, 17, 33, 38, 60, and 63 only.
3
To reach the edges, click the Wireframe Rendering button in the Graphics toolbar. Note that you can make the selection by clicking the Paste Selection button and typing the indices in the dialog box that opens.
4
In the Settings window for Ignore Edges, click  Build Selected.
Materials
Interior Wall
1
In the Materials toolbar, click  Blank Material.
2
In the Settings window for Material, type Interior Wall in the Label text field.
3
4
Locate the Material Contents section. In the table, enter the following settings:
Isolation
1
In the Materials toolbar, click  Blank Material.
2
In the Settings window for Material, type Isolation in the Label text field.
3
4
Locate the Material Contents section. In the table, enter the following settings:
Exterior Wall
1
In the Materials toolbar, click  Blank Material.
2
In the Settings window for Material, type Exterior Wall in the Label text field.
3
4
Locate the Material Contents section. In the table, enter the following settings:
Horizontal Structure
1
In the Materials toolbar, click  Blank Material.
2
In the Settings window for Material, type Horizontal Structure in the Label text field.
3
4
Locate the Material Contents section. In the table, enter the following settings:
Floor
1
In the Materials toolbar, click  Blank Material.
2
In the Settings window for Material, type Floor in the Label text field.
3
4
Locate the Material Contents section. In the table, enter the following settings:
Heat Transfer in Solids (ht)
Heat Flux 1
1
In the Model Builder window, under Component 1 (comp1) right-click Heat Transfer in Solids (ht) and choose Heat Flux.
2
3
In the Settings window for Heat Flux, locate the Boundary Selection section.
4
Click  Create Selection.
5
In the Create Selection dialog box, type Alpha in the Selection name text field.
6
7
In the Settings window for Heat Flux, locate the Heat Flux section.
8
Click the Convective heat flux button.
9
In the h text field, type 1/0.2.
10
In the Text text field, type 20[degC].
Heat Flux 2
1
In the Physics toolbar, click  Boundaries and choose Heat Flux.
2
3
In the Settings window for Heat Flux, locate the Boundary Selection section.
4
Click  Create Selection.
5
In the Create Selection dialog box, type Beta in the Selection name text field.
6
7
In the Settings window for Heat Flux, locate the Heat Flux section.
8
Click the Convective heat flux button.
9
In the h text field, type 1/0.2.
10
In the Text text field, type 15[degC].
Heat Flux 3
1
In the Physics toolbar, click  Boundaries and choose Heat Flux.
2
3
In the Settings window for Heat Flux, locate the Boundary Selection section.
4
Click  Create Selection.
5
In the Create Selection dialog box, type Gamma in the Selection name text field.
6
7
In the Settings window for Heat Flux, locate the Heat Flux section.
8
Click the Convective heat flux button.
9
In the h text field, type 1/0.05.
10
In the Text text field, type 0[degC].
Study 1
In the Home toolbar, click  Compute.
Results
Temperature (ht)
The first default plot group shows the temperature distribution.
Surface
1
In the Model Builder window, expand the Temperature (ht) node, then click Surface.
2
In the Settings window for Surface, locate the Expression section.
3
From the Unit list, choose degC.
4
In the Temperature (ht) toolbar, click  Plot.
Follow the steps below to find the minimum temperatures of α and β as well as the heat flux of α, β, and γ.
Surface Minimum 1
1
In the Results toolbar, click  More Derived Values and choose Minimum>Surface Minimum.
2
In the Settings window for Surface Minimum, locate the Selection section.
3
From the Selection list, choose Alpha.
4
Locate the Expressions section. In the table, enter the following settings:
5
Click  Evaluate.
The displayed value should be close to 11.3°C.
Surface Minimum 2
1
In the Results toolbar, click  More Derived Values and choose Minimum>Surface Minimum.
2
In the Settings window for Surface Minimum, locate the Selection section.
3
From the Selection list, choose Beta.
4
Locate the Expressions section. In the table, enter the following settings:
5
Click  Evaluate.
The displayed value should be close to 11.1°C.
Surface Integration 1
1
In the Results toolbar, click  More Derived Values and choose Integration>Surface Integration.
2
In the Settings window for Surface Integration, locate the Selection section.
3
From the Selection list, choose Alpha.
4
Click Replace Expression in the upper-right corner of the Expressions section. From the menu, choose Component 1 (comp1)>Heat Transfer in Solids>Boundary fluxes>ht.q0 - Inward heat flux - W/m².
5
Click  Evaluate.
The displayed value should be close to 46.2 W.
Surface Integration 2
1
In the Results toolbar, click  More Derived Values and choose Integration>Surface Integration.
2
In the Settings window for Surface Integration, locate the Selection section.
3
From the Selection list, choose Beta.
4
Click Replace Expression in the upper-right corner of the Expressions section. From the menu, choose Component 1 (comp1)>Heat Transfer in Solids>Boundary fluxes>ht.q0 - Inward heat flux - W/m².
5
Click  Evaluate.
The displayed value should be close to 13.9 W.
Surface Integration 3
1
In the Results toolbar, click  More Derived Values and choose Integration>Surface Integration.
2
In the Settings window for Surface Integration, locate the Selection section.
3
From the Selection list, choose Gamma.
4
Click Replace Expression in the upper-right corner of the Expressions section. From the menu, choose Component 1 (comp1)>Heat Transfer in Solids>Boundary fluxes>ht.q0 - Inward heat flux - W/m².
5
Click  Evaluate.
Table
1
Go to the Table window.
The displayed value should be close to 60.1 W.
Results
Temperature (ht)
To plot the location of the minimum temperature on α, follow the instructions below.
The resulting dataset is restricted to the surfaces α.
Minimum Temperature on Alpha
1
In the Model Builder window, expand the Results>Datasets node.
2
Right-click Results and choose 3D Plot Group.
3
In the Settings window for 3D Plot Group, type Minimum Temperature on Alpha in the Label text field.
Surface 1
1
In the Minimum Temperature on Alpha toolbar, click  Surface.
2
In the Settings window for Surface, locate the Expression section.
3
From the Unit list, choose degC.
4
Locate the Coloring and Style section. From the Color table list, choose ThermalLight.
Selection 1
1
In the Minimum Temperature on Alpha toolbar, click  Selection.
2
In the Settings window for Selection, locate the Selection section.
3
From the Selection list, choose Alpha.
Minimum Temperature on Alpha
In the Model Builder window, click Minimum Temperature on Alpha.
Max/Min Surface 1
1
In the Minimum Temperature on Alpha toolbar, click  More Plots and choose Max/Min Surface.
2
In the Settings window for Max/Min Surface, locate the Expression section.
3
From the Unit list, choose degC.
Selection 1
1
In the Minimum Temperature on Alpha toolbar, click  Selection.
2
In the Settings window for Selection, locate the Selection section.
3
From the Selection list, choose Alpha.
4
In the Minimum Temperature on Alpha toolbar, click  Plot.
As shown in Figure 3, the minimum temperature is at the corner of α.
Now plot the location of the minimum temperature on β.
Minimum Temperature on Beta
1
Right-click Selection 1 and choose Duplicate.
2
In the Settings window for 3D Plot Group, type Minimum Temperature on Beta in the Label text field.
3
In the Model Builder window, expand the Minimum Temperature on Beta node.
Selection 1
1
In the Model Builder window, expand the Results>Minimum Temperature on Beta>Surface 1 node, then click Selection 1.
2
In the Settings window for Selection, locate the Selection section.
3
From the Selection list, choose Beta.
Selection 1
1
In the Model Builder window, expand the Results>Minimum Temperature on Beta>Max/Min Surface 1 node, then click Selection 1.
2
In the Settings window for Selection, locate the Selection section.
3
From the Selection list, choose Beta.
4
In the Minimum Temperature on Beta toolbar, click  Plot.