PDF

Free Convection in a Light Bulb
Introduction
This application simulates the nonisothermal flow of argon gas inside a light bulb. The purpose of the model is to show the coupling between energy transport — through conduction, radiation, and convection — and momentum transport induced by density variations in the argon gas.
All three forms of heat transfer are taken into account. First, you have conduction, when a 60 W filament is heated thus transferring heat from the heat source to the light bulb. Then there is convection, which drives a flow inside the bulb transferring the heat from the filament throughout the bulb via the movement of fluids (in this case, argon gas). Finally, there is the radiation portion of the problem, and in this case that includes surface-to-surface and surface-to-ambient radiation. The Heat Transfer Module includes both of these types of radiation, so that you can account for shading and reflections between radiating surfaces, as well as ambient radiation that can be fixed or given by an arbitrary function. The light bulb physics involves both heat transfer and gas flow, which makes this a multiphysics problem and not “just” a heat transfer example.
Note: This application requires the Heat Transfer Module and the Material Library.
Model Definition
A light bulb contains a tungsten filament that is resistively heated when a current is conducted through it. At temperatures around 2000 K the filament starts to emit visible light. To prevent the tungsten wire from burning up, the bulb is filled with a gas, usually argon. The heat generated in the filament is transported to the surroundings through radiation, convection, and conduction. As the gas heats up, density and pressure changes induce a flow inside the bulb.
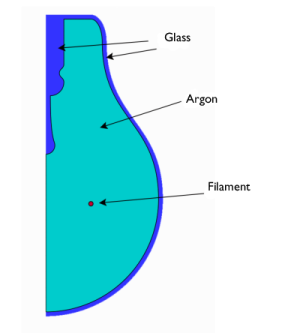
Figure 1 shows a cross section of the axially symmetric model geometry.
Figure 1: The model geometry.
The filament is approximated with a solid torus, an approximation that implies neglecting any internal effects inside the filament wire.
The equations governing the nonisothermal flow are the Navier-Stokes equations with the gravity forces (see Gravity in the CFD Module User’s Guide). The density is given by the ideal gas law
where M denotes the molar weight (kg/mol), R the universal gas constant (J/(mol·K)), and T the temperature (K).
The convective and conductive heat transfer are modeled using the heat transfer interface and account for the total light bulb power equal to 60 W.
Boundary Conditions
At the bulb’s inner surfaces, radiation is described by surface-to-surface radiation. This means that the mutual irradiation from the surfaces that can be seen from a particular surface and radiation to the surroundings are accounted for. At the outer surfaces of the bulb, radiation is described by surface-to-ambient radiation, which means that there is no reflected radiation from the surroundings (blackbody radiation).
The top part of the bulb, where the bulb is mounted on the cap, is insulated:
Results
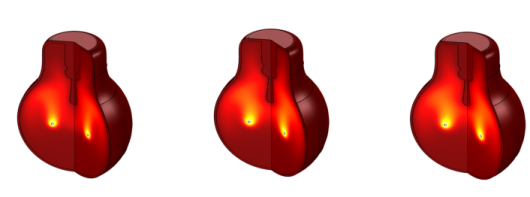
The heating inside the bulb has a long and a short time scale from t = 0, when the light is turned on. The shorter scale captures the heating of the filament and the gas close to it. The following series of pictures shows the temperature distribution inside the bulb at t = 2, 6, and 10 s.
Figure 2: Temperature distribution at t = 2, 6, and 10 s. The color ranges differ between the plots.
When the temperature changes, the density of the gas changes, inducing a gas flow inside the bulb. The following series of pictures shows the velocity field inside the bulb after 2, 6, and 10 s.
Figure 3: Velocity field after 2, 6, and 10 s. The color ranges differ between the plots.
On the longer time scale, the glass on the bulb’s outer side heats up. The following plot shows the temperature distribution in the bulb after 5 minutes.
Figure 4: Temperature distribution after 5 minutes.
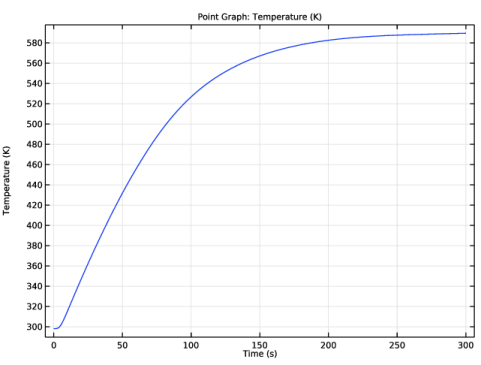
Figure 5 shows the temperature distribution at a point on the boundary of the bulb at the same vertical level as the filament. This plot shows the slow heating of the bulb. After 5 minutes, the bulb has reached a steady-state temperature of approximately 589 K.
Figure 5: Temperature distribution at a point on the boundary of the bulb at the same vertical level as the filament.
Heat is transported from the boundary of the bulb through both convective heat flux and radiation. The net radiative heat flux leaving the bulb at t = 300 s is plotted in Figure 6, as function of the z-coordinate. The top boundaries of the bulb where the bulb is mounted on the cap are excluded from this plot. The distinct bump in the curve occurs around z = 1.5 cm, above the filament.
Figure 6: The net radiative heat flux leaving the bulb.
Notes About the COMSOL Implementation
To set up the model, use the Heat Transfer Module’s Conjugate Heat Transfer predefined multiphysics coupling. The model uses material from the Material Library to accurately account for temperature-dependent properties over a wide range. The model setup is straightforward and also shows how to create your own material to treat argon as an ideal gas. When working with surface-to-surface radiation in COMSOL, fluid domains are considered as transparent and solid domains as opaque by default, which are the expected properties for this model. The assumption that the glass on the bulb is opaque might seem odd, but it is valid because glass is almost opaque to heat radiation but transparent to radiation in the visible spectrum.
Application Library path: Heat_Transfer_Module/Thermal_Radiation/light_bulb
Modeling Instructions
From the File menu, choose New.
New
In the New window, click  Model Wizard.
Model Wizard
1
In the Model Wizard window, click  2D Axisymmetric.
2
In the Select Physics tree, select Heat Transfer>Conjugate Heat Transfer>Laminar Flow.
3
Click Add.
4
In the Select Physics tree, select Heat Transfer>Radiation>Surface-to-Surface Radiation (rad).
5
Click Add.
6
Click  Study.
7
In the Select Study tree, select General Studies>Time Dependent.
8
Definitions
Ambient Properties 1 (ampr1)
1
In the Physics toolbar, click  Shared Properties and choose Ambient Properties.
2
In the Settings window for Ambient Properties, locate the Ambient Conditions section.
3
In the Tamb text field, type 25[degC].
Geometry 1
The geometry sequence for the model is available in a file. If you want to create it from scratch yourself, you can follow the instructions in the Geometry Modeling Instructions section. Otherwise, insert the geometry sequence as follows:
1
In the Geometry toolbar, click  Insert Sequence.
2
3
In the Geometry toolbar, click  Build All.
4
Click the  Zoom Extents button in the Graphics toolbar.
You should now see the geometry shown in Figure 1.
Global Definitions
Parameters 1
1
In the Model Builder window, under Global Definitions click Parameters 1.
2
In the Settings window for Parameters, locate the Parameters section.
3
Add Material
1
In the Home toolbar, click  Add Material to open the Add Material window.
2
Go to the Add Material window.
3
In the tree, select Material Library>Elements>Tungsten>Tungsten [solid]>Tungsten [solid,Ho et al].
4
Click Add to Component in the window toolbar.
Materials
Tungsten [solid,Ho et al] (mat1)
1
In the Settings window for Material, locate the Geometric Entity Selection section.
2
From the Selection list, choose Tungsten.
To apply the surface emissivity for tungsten as a material property, you also need to define tungsten as the material for the filament surface.
Add Material
1
Go to the Add Material window.
2
In the tree, select Material Library>Elements>Tungsten>Tungsten [solid]>Tungsten [solid,Ho et al].
3
Click Add to Component in the window toolbar.
4
In the Home toolbar, click  Add Material to close the Add Material window.
Materials
Tungsten [solid,Ho et al] 1 (mat2)
1
In the Settings window for Material, locate the Geometric Entity Selection section.
2
From the Geometric entity level list, choose Boundary.
3
From the Selection list, choose Tungsten Boundary.
Glass
1
In the Materials toolbar, click  Blank Material.
2
In the Settings window for Material, type Glass in the Label text field.
3
Locate the Geometric Entity Selection section. From the Selection list, choose Glass.
4
Locate the Material Contents section. In the table, enter the following settings:
Now, set up the physics to let COMSOL Multiphysics flag what properties you need to specify manually.
Laminar Flow (spf)
As the flow is driven by buoyancy, gravity matters.
1
In the Model Builder window, under Component 1 (comp1) click Laminar Flow (spf).
2
In the Settings window for Laminar Flow, locate the Physical Model section.
3
Select the Include gravity check box.
Since the density variation is not small, the flow cannot be regarded as incompressible. Therefore set the flow to be compressible.
4
From the Compressibility list, choose Compressible flow (Ma<0.3).
5
Locate the Domain Selection section. From the Selection list, choose Argon.
Define the pressure reference level in the interface properties.
6
Locate the Physical Model section. In the pref text field, type p0.
Heat Transfer in Solids and Fluids (ht)
Fluid 1
1
In the Model Builder window, under Component 1 (comp1)>Heat Transfer in Solids and Fluids (ht) click Fluid 1.
2
In the Settings window for Fluid, locate the Domain Selection section.
3
From the Selection list, choose Argon.
Initial Values 1
1
In the Model Builder window, click Initial Values 1.
2
In the Settings window for Initial Values, locate the Initial Values section.
3
From the T list, choose Ambient temperature (ampr1).
Heat Source 1
1
In the Physics toolbar, click  Domains and choose Heat Source.
2
In the Settings window for Heat Source, locate the Domain Selection section.
3
From the Selection list, choose Tungsten.
4
Locate the Heat Source section. Click the Heat rate button.
5
In the P0 text field, type Qf.
Heat Flux 1
1
In the Physics toolbar, click  Boundaries and choose Heat Flux.
2
In the Settings window for Heat Flux, locate the Boundary Selection section.
3
From the Selection list, choose Exterior Radiation.
4
Locate the Heat Flux section. Click the Convective heat flux button.
5
In the h text field, type h0.
6
From the Text list, choose Ambient temperature (ampr1).
Surface-to-Surface Radiation (rad)
1
In the Model Builder window, under Component 1 (comp1) click Surface-to-Surface Radiation (rad).
2
In the Settings window for Surface-to-Surface Radiation, locate the Boundary Selection section.
3
From the Selection list, choose Radiation.
Diffuse Surface 1
1
In the Model Builder window, under Component 1 (comp1)>Surface-to-Surface Radiation (rad) click Diffuse Surface 1.
2
In the Settings window for Diffuse Surface, locate the Ambient section.
3
Find the Ambient temperature subsection. From the Tamb list, choose Ambient temperature (ampr1).
By default, the radiation direction is controlled by the opacity of the domains. The solid parts are automatically defined as opaque while the fluid parts are transparent. You can change these settings by modifying the Opacity subnode under the Solid and Fluid features. For this model, the default settings apply.
Add Multiphysics
1
In the Physics toolbar, click  Add Multiphysics to open the Add Multiphysics window.
2
Go to the Add Multiphysics window.
3
Find the Select the physics interfaces you want to couple subsection. In the table, clear the Couple check box for Laminar Flow (spf).
4
In the tree, select Heat Transfer>Radiation>Heat Transfer with Surface-to-Surface Radiation.
5
Click Add to Component in the window toolbar.
6
In the Physics toolbar, click  Add Multiphysics to close the Add Multiphysics window.
Materials
Glass (Boundaries)
1
In the Materials toolbar, click  Blank Material.
2
In the Settings window for Material, type Glass (Boundaries) in the Label text field.
3
Locate the Geometric Entity Selection section. From the Geometric entity level list, choose Boundary.
4
From the Selection list, choose Glass Boundaries.
5
Locate the Material Contents section. In the table, enter the following settings:
Add Material
1
In the Materials toolbar, click  Add Material to open the Add Material window.
2
Go to the Add Material window.
3
In the tree, select Material Library>Elements>Argon>Argon [gas].
4
Click Add to Component in the window toolbar.
5
In the Materials toolbar, click  Add Material to close the Add Material window.
Materials
Argon [gas] (mat5)
1
In the Settings window for Material, locate the Geometric Entity Selection section.
2
From the Selection list, choose Argon.
As you can see, COMSOL Multiphysics warns about required properties that have not been defined yet. Define these as follows.
3
Locate the Material Contents section. In the table, enter the following settings:
Mesh 1
1
In the Model Builder window, under Component 1 (comp1) click Mesh 1.
2
In the Settings window for Mesh, locate the Physics-Controlled Mesh section.
3
From the Element size list, choose Fine.
4
Click  Build All.
Study 1
Step 1: Time Dependent
1
In the Model Builder window, under Study 1 click Step 1: Time Dependent.
2
In the Settings window for Time Dependent, locate the Study Settings section.
3
In the Output times text field, type range(0,0.1,1) range(1.5,0.5,20) range(21,3,300).
4
In the Home toolbar, click  Compute.
Results
Temperature, 3D (ht)
The first default 3D plot shows the temperature at the end of the simulation interval (Figure 4). Look at the temperature field at different times and compare the resulting series of plots with those in Figure 2.
1
Click the  Zoom Extents button in the Graphics toolbar.
2
In the Settings window for 3D Plot Group, locate the Data section.
3
From the Time (s) list, choose 2.
4
In the Temperature, 3D (ht) toolbar, click  Plot.
Compare with the left panel in Figure 2.
5
From the Time (s) list, choose 6.
6
In the Temperature, 3D (ht) toolbar, click  Plot.
Compare with the middle panel in Figure 2.
7
From the Time (s) list, choose 10.
8
In the Temperature, 3D (ht) toolbar, click  Plot.
Compare with the right panel in Figure 2.
Pressure (spf)
This default plot shows the pressure field in a 2D contour plot. Change the unit to kPa as follows.
Contour
1
In the Model Builder window, expand the Pressure (spf) node, then click Contour.
2
In the Settings window for Contour, locate the Expression section.
3
From the Unit list, choose kPa.
4
In the Pressure (spf) toolbar, click  Plot.
Velocity, 3D (spf)
This default plot shows the velocity magnitude in a 3D plot, obtained by a revolution of the 2D axisymmetric dataset, at the end of the simulation interval. Now proceed to reproduce the velocity field plots in Figure 3.
Surface
Because the velocity magnitude is a quadratic expression in the basic velocity variables it looks less smooth than the temperature plot. You can easily remedy the situation by adjusting the Quality settings.
1
In the Model Builder window, expand the Velocity, 3D (spf) node, then click Surface.
2
In the Settings window for Surface, click to expand the Quality section.
3
From the Resolution list, choose Fine.
4
In the Velocity, 3D (spf) toolbar, click  Plot. This ensures that the resolution is sufficient.
Velocity, 3D (spf)
1
In the Model Builder window, click Velocity, 3D (spf).
2
In the Settings window for 3D Plot Group, locate the Data section.
3
From the Time (s) list, choose 2.
4
In the Velocity, 3D (spf) toolbar, click  Plot.
Compare with the left panel in Figure 3.
5
From the Time (s) list, choose 6.
6
In the Velocity, 3D (spf) toolbar, click  Plot.
Compare with the middle panel in Figure 3.
7
From the Time (s) list, choose 10.
8
In the Velocity, 3D (spf) toolbar, click  Plot.
Compare with the right panel in Figure 3.
To visualize the heating of the bulb surface with time by plotting the temperature at a point at the same vertical level as the filament, follow the steps below.
Cut Point 2D 1
1
In the Results toolbar, click  Cut Point 2D.
2
In the Settings window for Cut Point 2D, locate the Point Data section.
3
In the r text field, type 26.
4
In the z text field, type 1.
Temperature vs. Time
1
In the Results toolbar, click  1D Plot Group.
2
In the Settings window for 1D Plot Group, type Temperature vs. Time in the Label text field.
Point Graph 1
1
Right-click Temperature vs. Time and choose Point Graph.
2
In the Settings window for Point Graph, locate the Data section.
3
From the Dataset list, choose Cut Point 2D 1.
4
Click Replace Expression in the upper-right corner of the y-Axis Data section. From the menu, choose Component 1 (comp1)>Heat Transfer in Solids and Fluids>Temperature>T - Temperature - K.
5
In the Temperature vs. Time toolbar, click  Plot.
Finally, study the radiative heat flux from the bulb. First plot the radiative heat flux versus the vertical coordinate, z.
Radiative Heat Flux along z-Coordinate
1
In the Home toolbar, click  Add Plot Group and choose 1D Plot Group.
2
In the Settings window for 1D Plot Group, type Radiative Heat Flux along z-Coordinate in the Label text field.
3
Locate the Data section. From the Time selection list, choose Last.
Line Graph 1
1
In the Radiative Heat Flux along z-Coordinate toolbar, click  Line Graph.
2
In the Settings window for Line Graph, locate the Selection section.
3
From the Selection list, choose Exterior Radiation.
4
Click Replace Expression in the upper-right corner of the y-Axis Data section. From the menu, choose Component 1 (comp1)>Surface-to-Surface Radiation>Radiative heat flux>rad.rflux - Radiative heat flux - W/m².
5
Click Replace Expression in the upper-right corner of the x-Axis Data section. From the menu, choose Component 1 (comp1)>Geometry>Coordinate>z - z-coordinate.
6
Locate the x-Axis Data section. From the Unit list, choose cm.
7
In the Radiative Heat Flux along z-Coordinate toolbar, click  Plot.
You can readily compute the total radiative heat flux from the bulb at steady state as follows.
Line Integration 1
1
In the Results toolbar, click  More Derived Values and choose Integration>Line Integration.
2
In the Settings window for Line Integration, locate the Data section.
3
From the Time selection list, choose Last.
4
Locate the Selection section. From the Selection list, choose Exterior Radiation.
5
Click Replace Expression in the upper-right corner of the Expressions section. From the menu, choose Component 1 (comp1)>Surface-to-Surface Radiation>Radiative heat flux>rad.rflux - Radiative heat flux - W/m².
6
Click  Evaluate.
Table
1
Go to the Table window.
The result should be close to 45 W.
Geometry Modeling Instructions
If you want to create the geometry yourself, follow these steps.
Geometry 1
1
In the Model Builder window, under Component 1 (comp1) click Geometry 1.
2
In the Settings window for Geometry, locate the Units section.
3
From the Length unit list, choose mm.
Polygon 1 (pol1)
1
In the Geometry toolbar, click  Polygon.
2
In the Settings window for Polygon, locate the Object Type section.
3
From the Type list, choose Open curve.
4
Locate the Coordinates section. In the table, enter the following settings:
Polygon 2 (pol2)
1
In the Geometry toolbar, click  Polygon.
2
In the Settings window for Polygon, locate the Object Type section.
3
From the Type list, choose Open curve.
4
Locate the Coordinates section. In the table, enter the following settings:
Interpolation Curve 1 (ic1)
1
In the Geometry toolbar, click  More Primitives and choose Interpolation Curve.
2
In the Settings window for Interpolation Curve, locate the Interpolation Points section.
3
4
Locate the End Conditions section. From the Condition at starting point list, choose Tangent direction.
5
In the r text field, type 0.
6
In the z text field, type -1.
7
From the Condition at endpoint list, choose Tangent direction.
8
In the r text field, type 0.
9
In the z text field, type -1.
Circle 1 (c1)
1
In the Geometry toolbar, click  Circle.
2
In the Settings window for Circle, locate the Object Type section.
3
From the Type list, choose Curve.
4
Locate the Size and Shape section. In the Radius text field, type 3.
5
In the Sector angle text field, type 90.
6
Locate the Position section. In the r text field, type 1.
7
In the z text field, type 27.
8
Locate the Rotation Angle section. In the Rotation text field, type -90.
Circle 2 (c2)
1
In the Geometry toolbar, click  Circle.
2
In the Settings window for Circle, locate the Object Type section.
3
From the Type list, choose Curve.
4
Locate the Size and Shape section. In the Radius text field, type 2.
5
In the Sector angle text field, type 90.
6
Locate the Position section. In the z text field, type 13.
7
Locate the Rotation Angle section. In the Rotation text field, type -90.
Line Segment 1 (ls1)
1
In the Geometry toolbar, click  More Primitives and choose Line Segment.
2
On the object c1, select Point 1 only.
3
In the Settings window for Line Segment, locate the Endpoint section.
4
Find the End vertex subsection. Select the  Activate Selection toggle button.
5
On the object c2, select Point 2 only.
Circle 3 (c3)
1
In the Geometry toolbar, click  Circle.
2
In the Settings window for Circle, locate the Object Type section.
3
From the Type list, choose Curve.
4
Locate the Size and Shape section. In the Radius text field, type 26.
5
In the Sector angle text field, type 135.
6
Locate the Position section. In the z text field, type 1.
7
Locate the Rotation Angle section. In the Rotation text field, type -90.
8
Click to expand the Layers section. In the table, enter the following settings:
Cubic Bézier 1 (cb1)
1
In the Geometry toolbar, click  More Primitives and choose Cubic Bézier.
2
In the Settings window for Cubic Bézier, locate the Control Points section.
3
In row 1, set r to 10 .
4
In row 2, set r to 18.
5
In row 3, set r to 10.
6
In row 4, set r to 13*sqrt(2).
7
In row 1, set z to 42.
8
In row 2, set z to 41.
9
In row 3, set z to 29.
10
In row 4, set z to 13*sqrt(2)+1.
Cubic Bézier 2 (cb2)
1
In the Geometry toolbar, click  More Primitives and choose Cubic Bézier.
2
In the Settings window for Cubic Bézier, locate the Control Points section.
3
In row 1, set r to 10 .
4
In row 2, set r to 18.
5
In row 3, set r to 9.
6
In row 4, set r to 12.5*sqrt(2).
7
In row 1, set z to 41.
8
In row 2, set z to 40.
9
In row 3, set z to 29.
10
In row 4, set z to 12.5*sqrt(2)+1.
11
Locate the Weights section. In the 2 text field, type 3/4.
Partition Edges 1 (pare1)
1
In the Geometry toolbar, click  Booleans and Partitions and choose Partition Edges.
2
On the object cb1, select Boundary 1 only.
3
In the Settings window for Partition Edges, locate the Positions section.
4
5
In the Geometry toolbar, click  Build All.
Delete Entities 1 (del1)
1
In the Geometry toolbar, click  Delete.
2
On the object c1, select Boundaries 2 and 3 only.
3
On the object c2, select Boundaries 2 and 3 only.
4
On the object c3, select Boundaries 1–4 only.
Circle 4 (c4)
1
In the Geometry toolbar, click  Circle.
2
In the Settings window for Circle, locate the Object Type section.
3
From the Type list, choose Curve.
4
Locate the Size and Shape section. In the Radius text field, type 0.5.
5
Locate the Position section. In the r text field, type 10.
Convert to Solid 1 (csol1)
1
In the Geometry toolbar, click  Conversions and choose Convert to Solid.
2
Click in the Graphics window and then press Ctrl+A to select all objects.
Form Union (fin)
1
In the Model Builder window, click Form Union (fin).
2
In the Settings window for Form Union/Assembly, click  Build Selected.
Argon
1
In the Geometry toolbar, click  Selections and choose Explicit Selection.
2
In the Settings window for Explicit Selection, type Argon in the Label text field.
3
On the object fin, select Domain 2 only.
Glass
1
In the Geometry toolbar, click  Selections and choose Explicit Selection.
2
In the Settings window for Explicit Selection, type Glass in the Label text field.
3
On the object fin, select Domain 1 only.
Tungsten
1
In the Geometry toolbar, click  Selections and choose Explicit Selection.
2
In the Settings window for Explicit Selection, type Tungsten in the Label text field.
3
On the object fin, select Domain 3 only.
Interior Radiation
1
In the Geometry toolbar, click  Selections and choose Explicit Selection.
2
In the Settings window for Explicit Selection, type Interior Radiation in the Label text field.
3
Locate the Entities to Select section. From the Geometric entity level list, choose Boundary.
4
Select the Group by continuous tangent check box.
5
On the object fin, select Boundaries 5–7, 9–16, 18, and 21 only.
Exterior Radiation
1
In the Geometry toolbar, click  Selections and choose Explicit Selection.
2
In the Settings window for Explicit Selection, type Exterior Radiation in the Label text field.
3
Locate the Entities to Select section. From the Geometric entity level list, choose Boundary.
4
On the object fin, select Boundaries 8, 17, and 20 only.
Radiation
1
In the Geometry toolbar, click  Selections and choose Union Selection.
2
In the Settings window for Union Selection, type Radiation in the Label text field.
3
Locate the Geometric Entity Level section. From the Level list, choose Boundary.
4
Locate the Input Entities section. Click  Add.
5
In the Add dialog box, in the Selections to add list, choose Interior Radiation and Exterior Radiation.
6
Glass Boundaries
1
In the Geometry toolbar, click  Selections and choose Adjacent Selection.
2
In the Settings window for Adjacent Selection, type Glass Boundaries in the Label text field.
3
Locate the Input Entities section. Click  Add.
4
In the Add dialog box, select Glass in the Input selections list.
5
Tungsten Boundary
1
In the Geometry toolbar, click  Selections and choose Adjacent Selection.
2
In the Settings window for Adjacent Selection, type Tungsten Boundary in the Label text field.
3
Locate the Input Entities section. Click  Add.
4
In the Add dialog box, select Tungsten in the Input selections list.
5