PDF

Action on Structures Exposed to Fire
— Cooling Process
Introduction
This is the first verification example from Ref. 1 which is part of the European Standard EN-1991-1-2:2010-12, Eurocode 1: Actions on structures - Part 1-2: General actions - Actions on structures exposed to fire. A transient cooling process is modeled. You verify that the numerical results obtained with COMSOL Multiphysics are within the validity ranges specified in the norm.
Model Definition
The modeled geometry is a square with a side length of 1 m. Figure 1 shows the geometry and setup.
Figure 1: Model geometry and setup.
The material properties are listed in Table 1.
Cp
The initial temperature is set to 1000°C and is cooled down using a heat flux condition on the bottom boundary according to
with the heat transfer coefficient h = 1 W/(m²·K) and the external temperature Text = 0°C. All other boundaries are adiabatic. The temperature evolution over 30 min is computed and the results are compared to the reference values given by Ref. 1. To fulfill the norm, the maximum derivation from the reference values must not exceed a relative error of 1% and an absolute error of 5 K.
Results and Discussion
The temperature distribution after 30 min is shown in Figure 2.
Figure 2: Temperature distribution after 30 min.
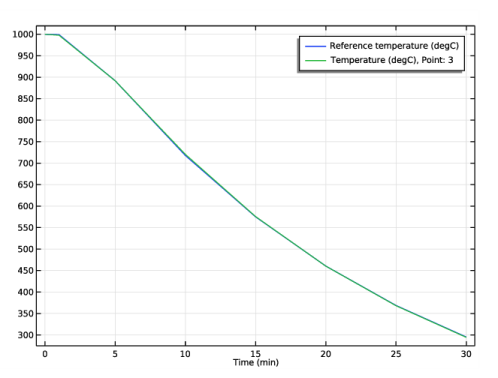
The reference and computed temperatures are compared in Figure 3. The numerical values match the norm data very well.
Figure 3: Reference (blue) and calculated temperature (green) over time.
The reference and calculated temperatures together with the absolute and relative errors for each time are listed in Table 2.
Table 2: Results.
Reference
1. DIN EN 1991-1-2/NA, National Annex - Nationally determined parameters - Eurocode 1: Actions on structures - Part 1-2: General actions - Actions on structures exposed to fire.
Application Library path: Heat_Transfer_Module/Verification_Examples/fire_effects_cooling
Modeling Instructions
From the File menu, choose New.
New
In the New window, click  Model Wizard.
Model Wizard
1
In the Model Wizard window, click  2D.
2
In the Select Physics tree, select Heat Transfer>Heat Transfer in Solids (ht).
3
Click Add.
4
Click  Study.
5
In the Select Study tree, select General Studies>Time Dependent.
6
Geometry 1
Square 1 (sq1)
In the Geometry toolbar, click  Square.
Point 1 (pt1)
1
In the Geometry toolbar, click  Point.
2
In the Settings window for Point, locate the Point section.
3
In the x text field, type 0.5.
4
In the y text field, type 1.
5
Click  Build All Objects.
Materials
Material 1 (mat1)
1
In the Model Builder window, under Component 1 (comp1) right-click Materials and choose Blank Material.
2
In the Settings window for Material, locate the Material Contents section.
3
Heat Transfer in Solids (ht)
Initial Values 1
1
In the Model Builder window, under Component 1 (comp1)>Heat Transfer in Solids (ht) click Initial Values 1.
2
In the Settings window for Initial Values, locate the Initial Values section.
3
In the T text field, type 1000[degC].
Heat Flux 1
1
In the Physics toolbar, click  Boundaries and choose Heat Flux.
2
In the Settings window for Heat Flux, locate the Heat Flux section.
3
Click the Convective heat flux button.
4
In the h text field, type 1.
5
In the Text text field, type 0[degC].
6
To compare the simulation results with the reference values, create an interpolation function for the norm data which are given in a file.
Global Definitions
Reference temperature
1
In the Home toolbar, click  Functions and choose Global>Interpolation.
2
In the Settings window for Interpolation, locate the Definition section.
3
From the Data source list, choose File.
4
Click Browse.
5
6
Click Import.
7
In the Label text field, type Reference temperature.
8
Locate the Definition section. In the Function name text field, type Tref.
9
Locate the Units section. In the Arguments text field, type s.
10
In the Function text field, type degC.
Study 1
Step 1: Time Dependent
1
In the Model Builder window, under Study 1 click Step 1: Time Dependent.
2
In the Settings window for Time Dependent, locate the Study Settings section.
3
From the Time unit list, choose min.
4
In the Output times text field, type 0 1 5 10 15 20 25 30.
5
In the Home toolbar, click  Compute.
Results
Temperature (ht)
A temperature and isothermal contour plot are created automatically. Compare the temperature plot with Figure 2.
Global Evaluation: Reference temperature
1
In the Results toolbar, click  Global Evaluation.
2
In the Settings window for Global Evaluation, locate the Expressions section.
3
4
In the Label text field, type Global Evaluation: Reference temperature.
5
Click  Evaluate.
Point Evaluation: Temperature
1
In the Results toolbar, click  Point Evaluation.
2
3
In the Settings window for Point Evaluation, locate the Expressions section.
4
5
In the Label text field, type Point Evaluation: Temperature.
Instead of creating a new table, evaluate the results in the same table as before.
6
Right-click on the Point Evaluation: Temperature node.
7
Go to Evaluate and click Table 1 - Global Evaluation: Reference temperature (Tref(t)).
Table
1
Go to the Table window.
2
Click Table Graph in the window toolbar.
Results
Temperature
1
In the Model Builder window, under Results click 1D Plot Group 3.
2
In the Settings window for 1D Plot Group, type Temperature in the Label text field.
Table Graph 1
1
In the Model Builder window, click Table Graph 1.
2
In the Settings window for Table Graph, click to expand the Legends section.
3
Select the Show legends check box.
The reference and computed values match very well (compare with Figure 3).
Finally, evaluate the absolute and relative errors.
Absolute and Relative Error
1
In the Results toolbar, click  Point Evaluation.
2
In the Settings window for Point Evaluation, type Absolute and Relative Error in the Label text field.
3
4
Locate the Expressions section. In the table, enter the following settings:
5
Click  Evaluate.
Table
1
Go to the Table window.
The absolute and relative errors are within the allowed range of 5K or 1% respectively. Compare with Table 2.