PDF

Forced Convection Cooling of an Enclosure with Fan and Grille
Introduction
This study simulates the thermal behavior of a computer power supply unit (PSU). Such electronic enclosures typically include cooling devices to avoid electronic components being damaged by excessively high temperatures. In this application, an extracting fan and a perforated grille generate an airflow in the enclosure to cool internal components.
Air extracted from the enclosure is related to the static pressure (the pressure difference between outside and inside), information that is generally provided by the fan manufacturers as a curve representing fluid velocity as a function of pressure difference.
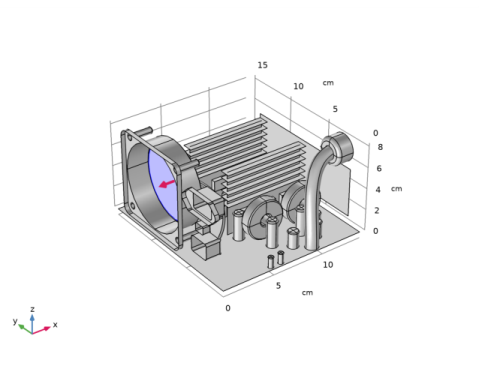
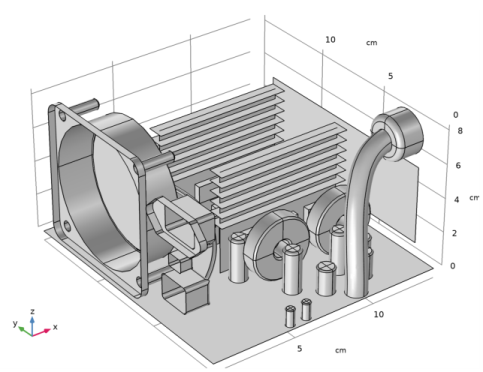
As shown in Figure 1, the geometry is rather complicated and requires a fine mesh to solve. This results in large computational costs in terms of time and memory.
Figure 1: The complete model geometry.
Model Definition
Figure 1 shows the geometry of the PSU. It is composed of a perforated enclosure of 14 cm-by-15 cm-by-8.6 cm and is made of aluminum 6063-T83. Inside the enclosure, only obstacles having a characteristic length of at least 5 mm are represented.
The bottom of the box represents the printed circuit board (PCB). It has an anisotropic thermal conductivity of 10, 10, and 0.36 W/(m·K) along the x-, y-, and z-axes, respectively. Its density is 430 kg/m3 and its heat capacity at constant pressure is 1100 J/(kg·K). Because the thermal conductivity along the z-axis is relatively low, and that the PCB and the enclosure sides are separated by a thin air layer, it is not necessary to model the bottom wall, nor take into account the cooling on these sides.
The capacitors are approximated by aluminum components. The heat sink fins and the enclosure are made of the same aluminum alloy. The inductors are mainly composed of steel cores and copper coils. The transformers are made of three materials: copper, steel, and plastic. The transistors are modeled as two-domain components: a core made of silicon held in a plastic case. The core is in contact with an aluminum heat sink to allow a more efficient heat transfer. The airflow is considered as turbulent and is modeled using the Algebraic yPlus turbulence model.
The simulated PSU consumes a maximum of 230 W. Components have been grouped and assigned to various heat sources as listed in Table 1. The overall heat loss is 41 W, which is about 82% of efficiency.
The inlet air temperature is set at 30 °C because it is supposed to come from the computer case in which air has already cooled other components. The inlet boundary is configured with a Grille boundary condition. This pressure must describe head loss caused by air entry into the enclosure. The head loss coefficient kgrille is represented by the following 6th order polynomial (Ref. 1):
(1)
where α is the opening ratio of the grille.
Figure 2: Head loss coefficient as a function of the opening ratio.
The head loss, ΔP (Pa), is given by
where ρ is the density (kg/m3), and U is the velocity magnitude (m/s).
The box, the PCB, the inductor surfaces, and the heat sink fins are configured as thin conductive layers.
Results and Discussion
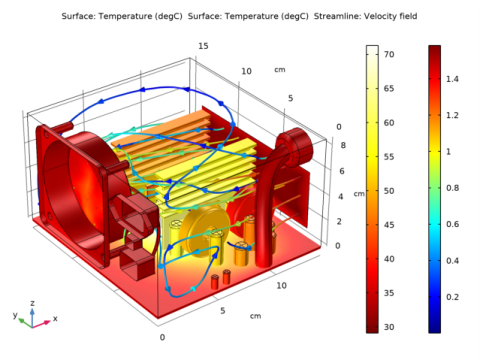
The most interesting aspect of this simulation is to locate which components are subject to overheating. Figure 3 clearly shows that the temperature distribution is not homogeneous.
Figure 3: Temperature and fluid velocity fields.
The maximum temperature is about 70 °C and is located at one of the transistor cores. The components furthest away from the air inlet are subject to the highest temperature. Although transistor cores are rather hot, Figure 3 shows that they are significantly cooled by the aluminum heat sinks. The printed circuit board has a significant impact as well by distributing and draining heat off.
On the flow side, air avoids obstacles and tends to go through the upper space of the enclosure. The maximum velocity is about 2 m/s.
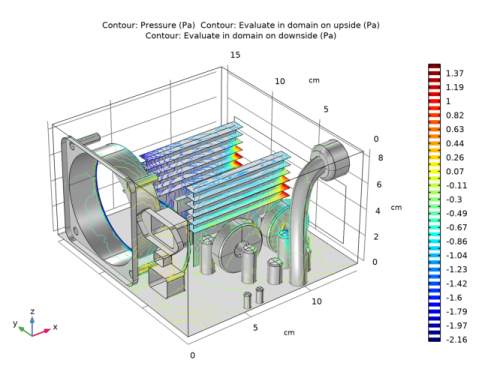
Figure 4 shows the head loss created by obstacles encountered by air on its path.
Figure 4: Pressure isosurfaces show the head loss created by electronic components.
As shown in Figure 4, the fluid flow is impacted by obstacles and yields to local head losses.
Notes About the COMSOL Implementation
To model heat sink fins, enclosure walls and circuit board it is strongly recommended to use the Thin Layer feature, which is completely adapted for thin geometries and significantly reduces the number of degrees of freedom in the model.
COMSOL Multiphysics provides a useful boundary condition for modeling fan behavior. You just need to provide a few points of a static pressure curve to configure this boundary condition. These data are, most of the time, provided by fan manufacturers.
Reference
1. R.D. Blevins, Applied Fluid Dynamics Handbook, Van Nostrand Reinhold, 1984.
Application Library path: Heat_Transfer_Module/Power_Electronics_and_Electronic_Cooling/electronic_enclosure_cooling
Modeling Instructions
Root
The file electronic_enclosure_cooling_geom.mph contains a parameterized geometry and prepared selections for the model. Start by loading this file.
1
From the File menu, choose Open.
2
Root
Global Definitions
Define an analytic function to represent the polynomial expression of the head loss coefficient (Equation 1). This coefficient is a function of the open ratio of the grille.
Analytic 1 (an1)
1
In the Home toolbar, click  Functions and choose Global>Analytic.
2
In the Settings window for Analytic, type k_grille in the Function name text field.
3
Locate the Definition section. In the Expression text field, type 12084*OR^6-42281*OR^5+60989*OR^4-46559*OR^3+19963*OR^2-4618.5*OR+462.89.
4
In the Arguments text field, type OR.
5
Locate the Units section. In the Arguments text field, type 1.
6
In the Function text field, type m^-4.
7
Locate the Plot Parameters section. In the table, enter the following settings:
8
Materials
In this section, you define the materials of the enclosure and its components. The prepared selections make it easier to select the appropriate domains and boundaries.
Add Material
1
In the Home toolbar, click  Add Material to open the Add Material window.
2
Go to the Add Material window.
3
4
Click Add to Component in the window toolbar.
5
In the tree, select Built-in>Acrylic plastic.
6
Click Add to Component in the window toolbar.
7
In the tree, select Built-in>Steel AISI 4340.
8
Click Add to Component in the window toolbar.
9
In the tree, select Built-in>Aluminum.
10
Click Add to Component in the window toolbar.
11
In the tree, select Built-in>Copper.
12
Click Add to Component in the window toolbar.
13
In the tree, select Built-in>Silicon.
14
Click Add to Component in the window toolbar.
15
In the tree, select Built-in>Aluminum 6063-T83.
16
Click Add to Component in the window toolbar.
17
In the tree, select Built-in>Copper.
18
Click Add to Component in the window toolbar.
19
In the Home toolbar, click  Add Material to close the Add Material window.
Materials
Air (mat1)
1
In the Model Builder window, under Component 1 (comp1)>Materials click Air (mat1).
2
In the Settings window for Material, locate the Geometric Entity Selection section.
3
From the Selection list, choose Air.
Acrylic plastic (mat2)
1
In the Model Builder window, click Acrylic plastic (mat2).
2
In the Settings window for Material, locate the Geometric Entity Selection section.
3
From the Selection list, choose Plastic.
Steel AISI 4340 (mat3)
1
In the Model Builder window, click Steel AISI 4340 (mat3).
2
In the Settings window for Material, locate the Geometric Entity Selection section.
3
From the Selection list, choose Steel Parts.
Aluminum (mat4)
1
In the Model Builder window, click Aluminum (mat4).
2
In the Settings window for Material, locate the Geometric Entity Selection section.
3
From the Selection list, choose Capacitors.
Copper (mat5)
1
In the Model Builder window, click Copper (mat5).
2
In the Settings window for Material, locate the Geometric Entity Selection section.
3
From the Selection list, choose Transformer Coils.
Silicon (mat6)
1
In the Model Builder window, click Silicon (mat6).
2
In the Settings window for Material, locate the Geometric Entity Selection section.
3
From the Selection list, choose Transistors Silicon Cores.
Heat Sink
1
In the Model Builder window, under Component 1 (comp1)>Materials click Aluminum 6063-T83 (mat7).
2
In the Settings window for Material, type Heat Sink in the Label text field.
3
Locate the Geometric Entity Selection section. From the Geometric entity level list, choose Boundary.
4
From the Selection list, choose Aluminum Boundaries.
5
Click to expand the Material Properties section. In the Material properties tree, select Geometric Properties>Shell>Thickness (lth).
6
Click  Add to Material.
7
Click to collapse the Material Properties section. Locate the Material Contents section. In the table, enter the following settings:
Copper layers
1
In the Model Builder window, under Component 1 (comp1)>Materials click Copper 1 (mat8).
2
In the Settings window for Material, type Copper layers in the Label text field.
3
Locate the Geometric Entity Selection section. From the Geometric entity level list, choose Boundary.
4
From the Selection list, choose Copper Layers.
5
Click to expand the Material Properties section. In the Material properties tree, select Geometric Properties>Shell>Thickness (lth).
6
Click  Add to Material.
7
Click to collapse the Material Properties section. Locate the Material Contents section. In the table, enter the following settings:
FR4 (Circuit Board)
1
In the Model Builder window, right-click Materials and choose Blank Material.
2
In the Settings window for Material, type FR4 (Circuit Board) in the Label text field.
3
Locate the Geometric Entity Selection section. From the Geometric entity level list, choose Boundary.
4
From the Selection list, choose Circuit Board.
5
Click to expand the Material Properties section. In the Material properties tree, select Geometric Properties>Shell>Thickness (lth).
6
Click  Add to Material.
7
In the Material properties tree, select Basic Properties>Heat Capacity at Constant Pressure.
8
Click  Add to Material.
9
In the Material properties tree, select Basic Properties>Density.
10
Click  Add to Material.
11
In the Material properties tree, select Basic Properties>Thermal Conductivity.
12
Click  Add to Material.
13
Click to collapse the Material Properties section. Locate the Material Contents section. In the table, enter the following settings:
14
Right-click the Thermal conductivity row and choose Edit.
15
In the Thermal conductivity dialog box, choose Diagonal from the list.
16
17
The next steps define the boundary conditions of the model.
Definitions (comp1)
Ambient Properties 1 (ampr1)
1
In the Model Builder window, expand the Component 1 (comp1)>Heat Transfer in Solids and Fluids (ht) node.
2
Right-click Component 1 (comp1)>Definitions and choose Shared Properties>Ambient Properties.
Set the ambient temperature to be used in initial values of the Heat Transfer interface.
3
In the Settings window for Ambient Properties, locate the Ambient Conditions section.
4
In the Tamb text field, type 30[degC].
Heat Transfer in Solids and Fluids (ht)
Fluid 1
1
In the Model Builder window, under Component 1 (comp1)>Heat Transfer in Solids and Fluids (ht) click Fluid 1.
2
In the Settings window for Fluid, locate the Domain Selection section.
3
From the Selection list, choose Air.
Initial Values 1
1
In the Model Builder window, click Initial Values 1.
2
In the Settings window for Initial Values, locate the Initial Values section.
3
From the T list, choose Ambient temperature (ampr1).
Now, define the heat rate produced by the different components. Table 1 summarizes the values chosen for each kind of component.
Heat Source 1: Transistors
1
In the Physics toolbar, click  Domains and choose Heat Source.
2
In the Settings window for Heat Source, type Heat Source 1: Transistors in the Label text field.
3
Locate the Domain Selection section. From the Selection list, choose Transistors Silicon Cores.
4
Locate the Heat Source section. Click the Heat rate button.
5
In the P0 text field, type 25.
Heat Source 2: Large Transformer Coil
1
In the Physics toolbar, click  Domains and choose Heat Source.
2
In the Settings window for Heat Source, type Heat Source 2: Large Transformer Coil in the Label text field.
3
Locate the Domain Selection section. From the Selection list, choose Large Transformer Coil.
4
Locate the Heat Source section. Click the Heat rate button.
5
In the P0 text field, type 5.
Heat Source 3: Small Transformer Coils
1
In the Physics toolbar, click  Domains and choose Heat Source.
2
In the Settings window for Heat Source, type Heat Source 3: Small Transformer Coils in the Label text field.
3
Locate the Heat Source section. Click the Heat rate button.
4
In the P0 text field, type 3.
5
Locate the Domain Selection section. From the Selection list, choose Small Transformer Coils.
Heat Source 4: Inductor
1
In the Physics toolbar, click  Domains and choose Heat Source.
2
In the Settings window for Heat Source, type Heat Source 4: Inductor in the Label text field.
3
Locate the Domain Selection section. From the Selection list, choose Inductors.
4
Locate the Heat Source section. Click the Heat rate button.
5
In the P0 text field, type 2.
Heat Source 5: Large Capacitors
1
In the Physics toolbar, click  Domains and choose Heat Source.
2
In the Settings window for Heat Source, type Heat Source 5: Large Capacitors in the Label text field.
3
Locate the Domain Selection section. From the Selection list, choose Large Capacitors.
4
Locate the Heat Source section. Click the Heat rate button.
5
In the P0 text field, type 2.
Heat Source 6: Medium Capacitors
1
In the Physics toolbar, click  Domains and choose Heat Source.
2
In the Settings window for Heat Source, type Heat Source 6: Medium Capacitors in the Label text field.
3
Locate the Domain Selection section. From the Selection list, choose Medium Capacitors.
4
Locate the Heat Source section. Click the Heat rate button.
5
In the P0 text field, type 3.
Heat Source 7: Small Capacitors
1
In the Physics toolbar, click  Domains and choose Heat Source.
2
In the Settings window for Heat Source, type Heat Source 7: Small Capacitors in the Label text field.
3
Locate the Domain Selection section. From the Selection list, choose Small Capacitors.
4
Locate the Heat Source section. Click the Heat rate button.
5
In the P0 text field, type 1.
Inflow 1
1
In the Physics toolbar, click  Boundaries and choose Inflow.
2
In the Settings window for Inflow, locate the Boundary Selection section.
3
From the Selection list, choose Grille.
4
Locate the Upstream Properties section. From the Tustr list, choose Ambient temperature (ampr1).
Thin Layer 1
1
In the Physics toolbar, click  Boundaries and choose Thin Layer.
2
In the Settings window for Thin Layer, locate the Boundary Selection section.
3
From the Selection list, choose Conductive Layers.
4
Locate the Layer Model section. From the Layer type list, choose Thermally thin approximation.
Outflow 1
1
In the Physics toolbar, click  Boundaries and choose Outflow.
2
In the Settings window for Outflow, locate the Boundary Selection section.
3
From the Selection list, choose Fan.
Turbulent Flow, Algebraic yPlus (spf)
1
In the Model Builder window, under Component 1 (comp1) click Turbulent Flow, Algebraic yPlus (spf).
2
In the Settings window for Turbulent Flow, Algebraic yPlus, locate the Domain Selection section.
3
From the Selection list, choose Air.
4
Locate the Turbulence section. From the Wall treatment list, choose Low Re.
The thin heat sink fins are represented by interior boundaries in the geometry. An interior wall condition is used to prevent the fluid from flowing through these boundaries.
Interior Wall 1
1
In the Physics toolbar, click  Boundaries and choose Interior Wall.
2
In the Settings window for Interior Wall, locate the Boundary Selection section.
3
From the Selection list, choose Fins.
Fan 1
1
In the Physics toolbar, click  Boundaries and choose Fan.
2
In the Settings window for Fan, locate the Boundary Selection section.
3
From the Selection list, choose Fan.
4
Locate the Flow Direction section. From the Flow direction list, choose Outlet.
The Graphics window displays an arrow indicating the orientation of the flow through the fan. Compare with the figure below.
Here, the Fan condition is set up by loading a data file for the static pressure curve.
5
Locate the Parameters section. From the Static pressure curve list, choose Static pressure curve data.
6
Locate the Static Pressure Curve Data section. Click  Load from File.
7
8
Locate the Static Pressure Curve Interpolation section. From the Interpolation function type list, choose Piecewise cubic.
The exhaust fan previously defined extracts air entering from an opposite grille. Proceed to create the corresponding boundary condition.
Grille 1
1
In the Physics toolbar, click  Boundaries and choose Grille.
2
In the Settings window for Grille, locate the Boundary Selection section.
3
From the Selection list, choose Grille.
4
Locate the Parameters section. In the qlc text field, type k_grille(OR)*nitf1.rho/2.
Initial Values 1
1
In the Model Builder window, click Initial Values 1.
2
In the Settings window for Initial Values, locate the Initial Values section.
3
Specify the u vector as
Mesh 1
Now configure the meshing part. Start by discretizing the surfaces of key components. They would drive the tetrahedral mesh of the whole domain. Boundary layers at walls are added at the end.
Mapped 1
In the Mesh toolbar, click  Boundary and choose Mapped.
Size
1
In the Model Builder window, click Size.
2
In the Settings window for Size, locate the Element Size section.
3
From the Predefined list, choose Coarse.
Mapped 1
1
In the Model Builder window, click Mapped 1.
2
In the Settings window for Mapped, locate the Boundary Selection section.
3
From the Selection list, choose Wire Group Surface.
4
Click to expand the Reduce Element Skewness section. In order to get a regular mesh, select the option to adjust the mesh position on the edges in the swept direction.
5
Select the Adjust edge mesh check box.
Size 1
1
Right-click Mapped 1 and choose Size.
2
In the Settings window for Size, locate the Element Size section.
3
From the Predefined list, choose Finer.
4
Click the Custom button.
5
Locate the Element Size Parameters section. Select the Maximum element size check box.
6
7
Select the Minimum element size check box.
8
9
Click  Build Selected.
Mapped 2
1
In the Mesh toolbar, click  Boundary and choose Mapped.
2
In the Settings window for Mapped, locate the Boundary Selection section.
3
From the Selection list, choose Small Wire Surface.
4
Locate the Reduce Element Skewness section. Select the Adjust edge mesh check box.
Size 1
1
Right-click Mapped 2 and choose Size.
2
In the Settings window for Size, locate the Element Size section.
3
From the Calibrate for list, choose Fluid dynamics.
4
From the Predefined list, choose Extra fine.
5
Click the Custom button.
6
Locate the Element Size Parameters section. Select the Maximum element size check box.
7
8
Click  Build Selected.
Free Triangular 1
1
In the Mesh toolbar, click  Boundary and choose Free Triangular.
2
In the Settings window for Free Triangular, locate the Boundary Selection section.
3
From the Selection list, choose Heat Exchange Surface.
Size 1
1
Right-click Free Triangular 1 and choose Size.
2
In the Settings window for Size, locate the Element Size section.
3
Click the Custom button.
4
Locate the Element Size Parameters section. Select the Maximum element size check box.
5
6
Select the Minimum element size check box.
7
8
Select the Maximum element growth rate check box.
9
10
Select the Curvature factor check box.
11
12
Select the Resolution of narrow regions check box.
13
14
Click  Build Selected.
Free Triangular 2
1
In the Mesh toolbar, click  Boundary and choose Free Triangular.
2
In the Settings window for Free Triangular, locate the Boundary Selection section.
3
From the Selection list, choose Curved Area.
Size 1
1
Right-click Free Triangular 2 and choose Size.
2
In the Settings window for Size, locate the Element Size section.
3
From the Calibrate for list, choose Fluid dynamics.
4
Click  Build Selected.
Free Tetrahedral 1
In the Mesh toolbar, click  Free Tetrahedral.
Boundary Layers 1
1
In the Mesh toolbar, click  Boundary Layers.
2
In the Settings window for Boundary Layers, locate the Geometric Entity Selection section.
3
From the Geometric entity level list, choose Domain.
4
From the Selection list, choose Air.
5
Click to expand the Corner Settings section. From the Handling of sharp edges list, choose Trimming.
Boundary Layer Properties
1
In the Model Builder window, expand the Boundary Layers 1 node, then click Boundary Layer Properties.
2
In the Settings window for Boundary Layer Properties, locate the Boundary Selection section.
3
From the Selection list, choose Walls.
4
Locate the Boundary Layer Properties section. In the Number of boundary layers text field, type 3.
5
Click  Build All.
Study 1
In the Home toolbar, click  Compute.
Results
Temperature (ht)
The first default plot shows the temperature field. To reproduce the plot in Figure 3 of the temperature and the air velocity, proceed as follows.
Surface 1
1
In the Model Builder window, expand the Temperature (ht) node, then click Surface 1.
2
In the Settings window for Surface, locate the Expression section.
3
From the Unit list, choose degC.
Surface 2
1
In the Model Builder window, click Surface 2.
2
In the Settings window for Surface, locate the Expression section.
3
From the Unit list, choose degC.
Temperature (ht)
In the Model Builder window, click Temperature (ht).
Streamline 1
1
In the Temperature (ht) toolbar, click  Streamline.
2
In the Settings window for Streamline, click Replace Expression in the upper-right corner of the Expression section. From the menu, choose Component 1 (comp1)>Turbulent Flow, Algebraic yPlus>Velocity and pressure>u,v,w - Velocity field.
3
Locate the Selection section. From the Selection list, choose Grille.
4
Locate the Coloring and Style section. Find the Line style subsection. From the Type list, choose Tube.
5
Find the Point style subsection. From the Type list, choose Arrow.
Color Expression 1
1
In the Temperature (ht) toolbar, click  Color Expression.
2
In the Settings window for Color Expression, click Replace Expression in the upper-right corner of the Expression section. From the menu, choose Component 1 (comp1)>Turbulent Flow, Algebraic yPlus>Velocity and pressure>spf.U - Velocity magnitude - m/s.
3
In the Temperature (ht) toolbar, click  Plot.
Velocity (spf)
The third default plot group shows the air velocity profile in a slice plot.
Pressure (spf)
This last default plot group shows the pressure field plot as in Figure 4.