PDF

Pulse Reverse Plating
Introduction
This tutorial explores how pulse reverse plating can be used as an additive-free alternative to attenuate small protrusions during copper metal deposition. By adjusting the process parameters, including the length of the forward and reverse pulses (duty cycles), a bright mirror-like metal surface can be created. Pulse reverse plating may also be used for improved dimensional control of printed circuit board (PCB) plating (Ref. 1), for co-deposition of metal alloys.
The model assumes that a quasi-stationary current distribution establishes quickly during each pulse, so that an average of the forward and reverse deposition rates can be used in the time-dependent deforming geometry simulation.
Model Definition
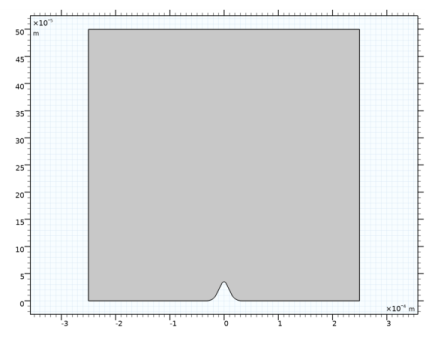
Figure 1 shows the model geometry. The single domain consists of an electrolyte with a conductivity of 5 S/m. The electrode surface is located at y = 0 mm, with a small protrusion with a height of 40 mm, centered around x = 0. The local current density iloc on electrode surface is modeled using Butler-Volmer kinetics.
Figure 1: Model geometry.
On the electrode surface, copper is assumed to be deposited according to
(1)
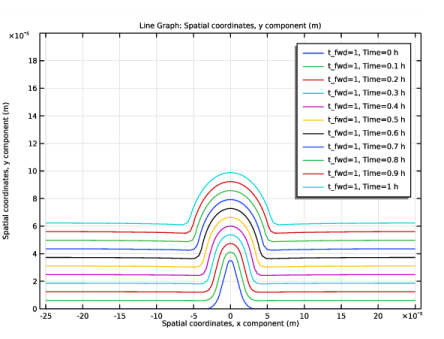
When modeling constant direct current (DC) plating, the average electrolyte current density of iavg, fwd = 5 A/dm2 is applied on the top boundary, and the resulting growth velocity along the electrode surface is used as a boundary condition for the deformed geometry (ALE) time-dependent simulation.
For the pulse reverse simulations, the average current density for the reverse pulse on the top boundary is set to iavg, rev = −50 A/dm2. Denoting the forward duty cycle (the relative time spent in forward mode) as tfwd (dimensionless), the forward pulse average current density can be calculated as
(2)
The simulated plating time is 1 h, whereas the forward-to-reverse pulse switching is assumed to occur on a time scale significantly shorter (a few seconds), since concentration gradients due to the mass-transport limitations at the higher current densities during the reverse pulse must not be allowed to form.
The current distributions for the pulse reverse plating are assumed to be quasi-stationary within each pulse period, and the current distributions during the forward and the reverse pulse are solved simultaneously on the same time-dependent geometry, using different potential dependent variables. The local growth velocity on the electrode surface is then based on the time-averaged sum of the local current densities during the forward and reverse pulses:
(3)
where ρ and M are the density and molar mass or copper, respectively, and iloc, fwd and iloc, rev are the local current density on the electrode surface during the forward and reverse pulses.
Solving the quasi-stationary current distributions separately for the forward and reverse pulses, using constant average current densities for each pulse period, saves computational time. The reason is that the time-dependent solver then does not need to resolve the explicit switching of the current density.
 
 
In order to mitigate potential issues with inverted mesh elements, the upper boundary is moved using a velocity proportional to the average current density according to
(4)
Results and Discussion
Figure 2 shows the electrode profile evolution during pure DC plating. The initial protrusion grows in size and will result in a non-even surface.
Figure 2: Profile evolution during DC plating.
Figure 3 shows the profile evolution for tfwd = 0.85. The initial protrusion is now attenuated, approaching a flat surface as the plating proceeds.
Figure 3: Profile evolution for tfwd = 0.85.
Finally, Figure 4 shows a comparison of the final profiles at t=1 h.
Figure 4: Comparison of final electrode surface profiles for different values of tfwd.
Reference
1. P. Leisner, P. Møller, M. Fredenberg, and I. Belov, “Recent progress in pulse reversal plating of copper for electronics applications,” Transactions of the IMF, vol. 85, no. 1, pp. 40–45, 2007.
Application Library path: Electrodeposition_Module/Tutorials/pulse_reverse_plating
Modeling Instructions
This tutorial consists of two parts. In the first part you will set up a direct current (DC) plating model to simulate how a small protrusion grows during the plating process.
In the second part you will add a current distribution model also for a reverse plating pulse, and examine how the protrusion is attenuated depending on the length of the reverse pulse.
From the File menu, choose New.
New
In the New window, click  Model Wizard.
Model Wizard
1
In the Model Wizard window, click  2D.
2
In the Select Physics tree, select Electrochemistry>Electrodeposition, Deformed Geometry>Electrodeposition, Secondary.
3
Click Add.
4
Click  Study.
5
In the Select Study tree, select Preset Studies for Selected Physics Interfaces>Secondary Current Distribution>Time Dependent with Initialization.
6
Global Definitions
Parameters 1
Load the model parameters from a text file.
1
In the Model Builder window, under Global Definitions click Parameters 1.
2
In the Settings window for Parameters, locate the Parameters section.
3
Click  Load from File.
4
Geometry 1
Polygon 1 (pol1)
1
In the Geometry toolbar, click  Polygon.
Load the coordinates of corners of the geometry from a text file.
2
In the Settings window for Polygon, locate the Coordinates section.
3
Click  Load from File.
4
5
Click  Build Selected.
Fillet 1 (fil1)
Round the corners by adding fillets.
1
In the Geometry toolbar, click  Fillet.
2
On the object pol1, select Point 4 only.
3
In the Settings window for Fillet, locate the Radius section.
4
In the Radius text field, type H_prot/10.
5
Click  Build Selected.
Fillet 2 (fil2)
1
In the Geometry toolbar, click  Fillet.
2
On the object fil1, select Points 3 and 6 only.
3
In the Settings window for Fillet, locate the Radius section.
4
In the Radius text field, type W_prot/2.
5
Click  Build Selected.
Secondary Current Distribution (cd)
Now start setting up the DC plating current distribution model.
Electrolyte 1
1
In the Model Builder window, under Component 1 (comp1)>Secondary Current Distribution (cd) click Electrolyte 1.
2
In the Settings window for Electrolyte, locate the Electrolyte section.
3
From the σl list, choose User defined. In the associated text field, type sigma.
Electrolyte Current 1
1
In the Physics toolbar, click  Boundaries and choose Electrolyte Current.
2
3
In the Settings window for Electrolyte Current, locate the Electrolyte Current section.
4
From the list, choose Average current density.
5
In the il,average text field, type i_avg.
Electrode Surface 1
1
In the Physics toolbar, click  Boundaries and choose Electrode Surface.
Use a box selection to select all the (lower) boundaries pertaining to the electrode surface, including the protrusion.
2
3
In the Settings window for Electrode Surface, locate the Boundary Selection section.
4
Click  Create Selection.
By creating a selection in this way you can conveniently select the same set of boundaries again later on.
5
In the Create Selection dialog box, type Electrode Surface in the Selection name text field.
6
7
In the Settings window for Electrode Surface, click to expand the Dissolving-Depositing Species section.
Use a Dissolving-Depositing Species to define the growth velocity of the electrode surface.
8
9
10
Clear the Solve for surface concentration variables check box.
Electrode Reaction 1
1
In the Model Builder window, expand the Electrode Surface 1 node, then click Electrode Reaction 1.
2
In the Settings window for Electrode Reaction, locate the Stoichiometric Coefficients section.
3
In the n text field, type 2.
4
In the Stoichiometric coefficients for dissolving-depositing species: table, enter the following settings:
5
Locate the Electrode Kinetics section. From the Kinetics expression type list, choose Butler-Volmer.
6
In the i0 text field, type i0.
7
In the αa text field, type alpha_a.
8
In the αc text field, type alpha_c.
Multiphysics
Nondeforming Boundary 1 (ndb1)
Modify the default selection of the Nondeforming Boundary node to only include the vertical boundaries.
1
In the Model Builder window, under Component 1 (comp1)>Multiphysics click Nondeforming Boundary 1 (ndb1).
2
3
In the Settings window for Nondeforming Boundary, locate the Nondeforming Boundary section.
4
From the Boundary condition list, choose Zero normal displacement.
Definitions
We will now set up the boundary velocity of the upper boundary to a user-defined expression. First, load some variable expressions from a text file.
Variables 1
1
In the Model Builder window, under Component 1 (comp1) right-click Definitions and choose Variables.
2
In the Settings window for Variables, locate the Variables section.
3
Click  Load from File.
4
The vn_avg variable is marked in orange indicating a missing definition. This is expected. We will properly define and make use of this variable in the second part of the tutorial.
The vn_bnd variable will next be used now to set up the upper boundary velocity.
Deformed Geometry (dg)
In the Model Builder window, under Component 1 (comp1) click Deformed Geometry (dg).
Prescribed Normal Mesh Velocity 1
1
In the Physics toolbar, click  Boundaries and choose Prescribed Normal Mesh Velocity.
2
3
In the Settings window for Prescribed Normal Mesh Velocity, locate the Normal Mesh Velocity section.
4
In the vn text field, type -vn_bnd.
Mesh 1
Modify the mesh as follows to get more mesh elements along the electrode surface:
1
In the Model Builder window, under Component 1 (comp1) click Mesh 1.
2
In the Settings window for Mesh, locate the Mesh Settings section.
3
From the Sequence type list, choose User-controlled mesh.
Size 1
1
In the Model Builder window, right-click Free Triangular 1 and choose Size.
2
In the Settings window for Size, locate the Geometric Entity Selection section.
3
From the Geometric entity level list, choose Boundary.
4
From the Selection list, choose Electrode Surface.
5
Locate the Element Size section. Click the Custom button.
6
Locate the Element Size Parameters section. Select the Maximum element growth rate check box.
7
8
Click  Build All.
Study 1
The DC problem is now ready for solving. Change the simulation time to 1 hour.
Step 2: Time Dependent
1
In the Model Builder window, under Study 1 click Step 2: Time Dependent.
2
In the Settings window for Time Dependent, locate the Study Settings section.
3
From the Time unit list, choose h.
4
In the Home toolbar, click  Compute.
Results
Electrolyte Potential (cd)
Explore the plots that were created by default.
Electrolyte Current Density (cd)
Electrode Potential vs. Adjacent Reference (cd)
Secondary Current Distribution - Forward (Plating)
You have now completed the first DC part of this tutorial. We will now modify the DC current distribution model to represent the current distribution during the forward pulse.
1
In the Model Builder window, under Component 1 (comp1) click Secondary Current Distribution (cd).
2
In the Settings window for Secondary Current Distribution, type Secondary Current Distribution - Forward (Plating) in the Label text field.
Electrolyte Current 1
1
In the Model Builder window, under Component 1 (comp1)>Secondary Current Distribution - Forward (Plating) (cd) click Electrolyte Current 1.
2
In the Settings window for Electrolyte Current, locate the Electrolyte Current section.
3
In the il,average text field, type i_fwd.
Component 1 (comp1)
Now add a second current distribution interface to represent the current distribution during the reverse pulse.
Add Physics
1
In the Home toolbar, click  Add Physics to open the Add Physics window.
2
Go to the Add Physics window.
3
In the tree, select Electrochemistry>Primary and Secondary Current Distribution>Secondary Current Distribution (cd).
4
Click Add to Component 1 in the window toolbar.
5
In the Home toolbar, click  Add Physics to close the Add Physics window.
Secondary Current Distribution - Reverse (Dissolution)
In the Settings window for Secondary Current Distribution, type Secondary Current Distribution - Reverse (Dissolution) in the Label text field.
Electrolyte 1
Set up the physics for the reverse pulse in a similar way as for the forward pulse.
1
In the Model Builder window, under Component 1 (comp1)>Secondary Current Distribution - Reverse (Dissolution) (cd2) click Electrolyte 1.
2
In the Settings window for Electrolyte, locate the Electrolyte section.
3
From the σl list, choose User defined. In the associated text field, type sigma.
Electrolyte Current 1
1
In the Physics toolbar, click  Boundaries and choose Electrolyte Current.
2
3
In the Settings window for Electrolyte Current, locate the Electrolyte Current section.
4
From the list, choose Average current density.
5
In the il,average text field, type i_rev.
Electrode Surface 1
1
In the Physics toolbar, click  Boundaries and choose Electrode Surface.
2
In the Settings window for Electrode Surface, locate the Boundary Selection section.
3
From the Selection list, choose Electrode Surface.
4
Locate the Dissolving-Depositing Species section. Click  Add.
5
6
Clear the Solve for surface concentration variables check box.
Electrode Reaction 1
1
In the Model Builder window, expand the Electrode Surface 1 node, then click Electrode Reaction 1.
2
In the Settings window for Electrode Reaction, locate the Stoichiometric Coefficients section.
3
In the n text field, type 2.
4
In the Stoichiometric coefficients for dissolving-depositing species: table, enter the following settings:
5
Locate the Electrode Kinetics section. From the Kinetics expression type list, choose Butler-Volmer.
6
In the i0 text field, type i0.
7
In the αa text field, type alpha_a.
8
In the αc text field, type alpha_c.
Definitions
Variables 1
The vn_avg variable should now be marked in black.
Multiphysics
Deforming Electrode Surface 1 (des1)
Disable the Deforming Electrode Surface node and set up the boundary velocity for the electrode surface manually using the vn_avg variable.
1
In the Model Builder window, under Component 1 (comp1)>Multiphysics right-click Deforming Electrode Surface 1 (des1) and choose Disable.
Deformed Geometry (dg)
In the Model Builder window, under Component 1 (comp1) click Deformed Geometry (dg).
Prescribed Normal Mesh Velocity 2
1
In the Physics toolbar, click  Boundaries and choose Prescribed Normal Mesh Velocity.
2
In the Settings window for Prescribed Normal Mesh Velocity, locate the Boundary Selection section.
3
From the Selection list, choose Electrode Surface.
4
Locate the Normal Mesh Velocity section. In the vn text field, type -vn_avg.
5
Click to expand the Moving Boundary Smoothing section. Select the Enable moving boundary smoothing check box.
Study 1
Solver Configurations
The reverse pulse plating model is now ready for solving. Use a Parametric Sweep to simulate different lengths of the forward plating duty cycle.
Parametric Sweep
1
In the Model Builder window, expand the Study 1>Solver Configurations node.
2
Right-click Study 1 and choose Parametric Sweep.
3
In the Settings window for Parametric Sweep, locate the Study Settings section.
4
5
6
In the Study toolbar, click  Compute.
Results
Create a line plot to compare the shapes of the electrode surface at different times and values for the duty cycle values as follows:
Electrode Shape Comparison
1
In the Home toolbar, click  Add Plot Group and choose 1D Plot Group.
2
In the Settings window for 1D Plot Group, type Electrode Shape Comparison in the Label text field.
3
Locate the Data section. From the Dataset list, choose Study 1/Parametric Solutions 1 (sol3).
4
From the Time selection list, choose Last.
Line Graph 1
1
Right-click Electrode Shape Comparison and choose Line Graph.
2
In the Settings window for Line Graph, locate the Selection section.
3
From the Selection list, choose Electrode Surface.
4
Locate the y-Axis Data section. In the Expression text field, type y.
5
Locate the x-Axis Data section. From the Parameter list, choose Expression.
6
In the Expression text field, type x.
7
Click to expand the Legends section. Select the Show legends check box.
Electrode Shape Comparison
1
In the Model Builder window, click Electrode Shape Comparison.
2
In the Settings window for 1D Plot Group, click to expand the Title section.
3
Locate the Axis section. Select the Manual axis limits check box.
4
In the y minimum text field, type 0.
5
In the y maximum text field, type 2e-4.
6
In the Electrode Shape Comparison toolbar, click  Plot.
7
Locate the Data section. From the Parameter selection (t_fwd) list, choose First.
8
From the Time selection list, choose All.
9
In the Electrode Shape Comparison toolbar, click  Plot.
10
From the Parameter selection (t_fwd) list, choose Last.
11
In the Electrode Shape Comparison toolbar, click  Plot.