PDF

Under-Deposit Corrosion
Introduction
This example models the effect of corrosion product on galvanic corrosion between a magnesium alloy (AE44) and mild steel in contact with brine solution. The present model is based upon Galvanic Corrosion with Electrode Deformation model available in the Corrosion Module Application Library. In this model, deposition of magnesium hydroxide corrosion product is modeled using the interface tracking Level Set interface, in addition to dissolution of the magnesium alloy.
The example is based on a paper by W. Sun and others (Ref. 1).
Model Definition
The Galvanic Corrosion with Electrode Deformation model considered electrochemical reactions occurring at the magnesium and steel surfaces and deformation of magnesium surface due to the dissolution reaction, neglecting the effect of corrosion product formed at the electrode surfaces. The present model extends the Galvanic Corrosion with Electrode Deformation model by accounting for mass transport of Mg2+ and OH- ions, precipitation reaction forming magnesium hydroxide corrosion product (Mg(OH)2) and its effect on transport properties. The present model also tracks the corrosion product interface using the Level Set interface, which is used to describe transport properties separately for electrolyte and corrosion product deposition regions.
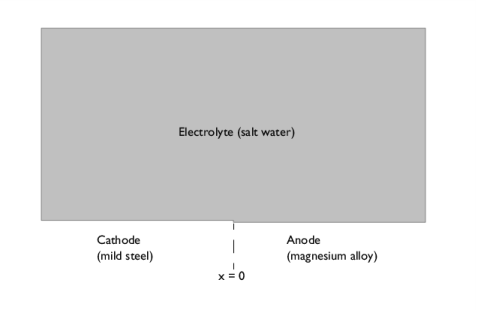
Figure 1: Model geometry.
The model geometry is the same as used in Galvanic Corrosion with Electrode Deformation model and is shown in Figure 1.
Electrochemical reactions
The magnesium alloy is an anode of the galvanic couple, oxidizing magnesium according to
The mild steel acts as a cathode for this galvanic couple, wherein oxygen reduction reaction occurs according to
The same electrode kinetics as described in Galvanic Corrosion with Electrode Deformation model is used here.
Mass transport
The transport of Mg2+ ions generated at the magnesium surface and OH- ions generated at the mild steel surface is considered to be by diffusion and migration mechanisms. Assuming diluted species in a supporting electrolyte, mass transport of the ionic species is prescribed using a Transport of Diluted Species interface according to
where Ni denotes the transport vector (SI unit: mol/(m2·s)), Di,eff the effective diffusion coefficients of the ionic species, ci the concentration in the electrolyte (SI unit: mol/m3), zi the charge for the ionic species, ui,eff the effective mobility of the charged species (SI unit: m2/(s·J·mole)), F Faraday’s constant (SI unit: A·s/mole), and the potential in the electrolyte (V).
The material balances are expressed through
one for each species, that is i = Mg2+ and OH-.
The transport properties such as effective diffusion coefficients, are defined using the electrolyte volume fraction:
where is the electrolyte volume fraction which is defined in terms of level set variable and varies from 1 in the electrolyte domain to 0 in the corrosion product deposition region, is the diffusion coefficients of the ionic species in the electrolyte domain and is the diffusion coefficients of the ionic species in the corrosion product deposition region.
Due to a porous nature of corrosion product deposits, diffusion coefficients need to be updated to account for the effect of porosity. Di,cp is defined in terms of MacMullin number, NM, and porosity of corrosion product region, , to define average characteristic of transport phenomenon in the deposited region according to (Ref. 1)
where is considered to be 0.55 and NM is defined according to
where is the tortuosity of corrosion product region and is considered to be 1.
The effective mobilities are calculated using the Nernst-Einstein relation:
The Mg2+ and OH- ions react with each other to form magnesium hydroxide precipitates according to
The precipitation reaction of magnesium hydroxide is assumed to be an irreversible reaction which initiates when the ion product, , exceeds the solubility product for magnesium hydroxide, (SI unit: mol3/m9). The rate of reaction for consumption of Mg2+ and OH- ions (SI unit: mol/(m2·s)) is described according to
where k is the precipitation reaction rate constant (SI unit: m7/(mol2·s)), H(ζ) is the Heaviside step function and ζ is the step function variable which is defined according to
The reaction source term (SI unit: (mol/(m3·s)) is defined in terms of the reaction rate for consumption of Mg2+ and OH- ions (SI unit: mol/(m2·s)) according to
where δ is the level set delta function which is used to prescribe the deposition reaction at the corrosion product interface.
The boundary condition at the magnesium surface is:
where n denotes the normal vector to the boundary.
The boundary condition at the magnesium surface is:
The initial conditions and concentration at the top boundary are set according to
All other boundaries are insulating:
Corrosion product interface tracking
The Level Set interface is used to keep track of the deformation due to corrosion product deposition. The Level Set interface automatically sets up the equations for the movement of the interface between the liquid electrolyte and the porous corrosion product. The interface is represented by the 0.5 contour of the level set variable . The level set variable varies from 1 in the electrolyte domain to 0 in the deposited region. The level set variable can thus be thought of as the electrolyte volume fraction. The transport of the level set variable is given by:
The ε parameter determines the thickness of the interface and is defined as ε = hmax/4, where hmax is the maximum mesh element size in the domain. The γ parameter determines the amount of reinitialization. A suitable value for γ is the maximum velocity magnitude occurring in the model.
The level set delta function is approximated by:
As the magnesium hydroxide corrosion product deposits at the electrode surfaces, the magnesium surface is also deforming due to dissolution reaction. The velocity field used in the transport equation for level set variable needs to account for both of these components: velocity representing magnesium hydroxide corrosion product deposition, udep (SI unit: m/s) and velocity representing magnesium dissolution, ucorr (SI unit: m/s).
The magnesium hydroxide corrosion product deposition velocity in normal direction is defined according to
where is the molar mass (58 g/mol) and is the density of Mg(OH)2 (2450 kg/m3).
The magnesium dissolution velocity in normal direction is defined according to
where is the mean molar mass (25 g/mol) and is the density (1820 kg/m3) of the magnesium alloy. Since ucorr is available only at the deforming boundary, we use a general extrusion operator to make it available throughout the domain as well.
Assuming that deposits form parallel vertical rods type of porous structure, only y-component of dissolution velocity is used in the level set transport equation. Hence, the velocity field used in the transport equation for level set variable is defined according to
where and are x- and y-components of the interface normal nLS which is defined in terms of level set variable according to
is y-component of the unit normal vector n, pointing out of the electrolyte domain.
The Heaviside step function ensures that the level set variable is convected only adjacent to the corrosion product region.
The level set variable of value 0 enters the domain from the bottommost boundaries of the domain, which are prescribed using the Inlet boundary condition. The rest of the boundaries are prescribed using the Outlet boundary condition.
Electrolyte properties
Finally, the effective electrolyte conductivity, , is defined for the electrolyte domain and the porous corrosion product region separately using the electrolyte volume fraction defined in terms of level set variable according to
where σ is the electrolyte conductivity in the electrolyte domain and is considered to be equal to 2.5 S/m.
The electrolyte conductivity in the corrosion product deposition region, , is described according to
where sL is the fluid saturation and is considered to be 1, m is the cementation exponent and is considered to be 1 and n is the saturation coefficient and is considered to be 2 in this model.
Solve the model in a time-dependent study, simulating the corrosion for three days of immersion in salt water.
Results and Discussion
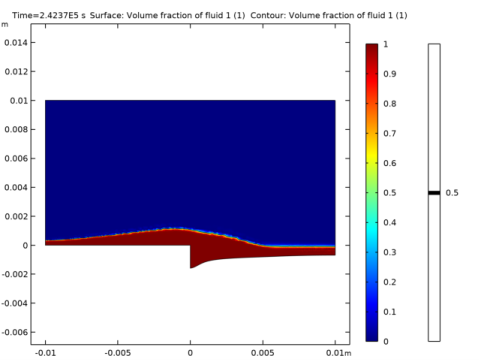
Figure 2 shows a surface plot of volume fraction of fluid 1 at the end of the simulation (t = 72 h). The region with volume fraction of fluid 1 of value 1 represents the corrosion product deposition whereas the same of value 0 represents the electrolyte. A contour plot of volume fraction of fluid 1 of value 0.5 represents the position of corrosion product interface at the end of the simulation. It can be seen that the corrosion product deposition is maximum at the contact point of the metals and it decreases with distance away from the contact point along the magnesium and mild steel surfaces. The corrosion product thickness is also found to be thicker at the magnesium surface than the same at the mild steel surface. This behavior is attributed to the faster precipitation reaction at the magnesium surface, since OH- ions transport faster than Mg2+ ions in the electrolyte. Figure 2 represents deformed boundaries due to deposition of corrosion product as well as dissolution of magnesium.
Figure 2: The corrosion product deposition and dissolution of magnesium after 72 h.
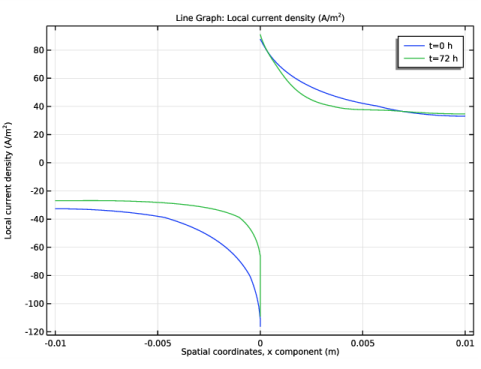
Figure 3 shows the electrode current densities at the beginning and the end of the simulation. As expected, the highest electrode current densities are found at the contact point between the two metals. However, the electrode current density distribution along the magnesium and mild steel surfaces is considerably different when compared to a scenario where the effect corrosion product is not considered (refer to Figure 2 in Galvanic Corrosion with Electrode Deformation model). It can be seen that the electrode current density at the end of the simulation is lower adjacent to the contact point between the two metals which is attributed to the corrosion product deposited at the magnesium and mild steel surfaces.
Figure 3: Electrode current densities at t = 0 and t = 72 h.
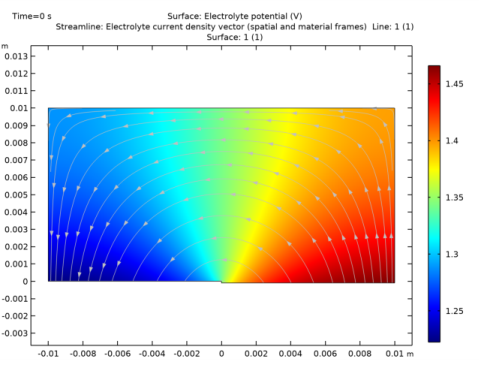
Figure 4 shows the current density and potential distribution in the electrolyte, and the model geometry, at the beginning of the simulation. The electrolyte potential and current density distribution at the beginning of simulations is the same as reported in Figure 3 of Galvanic Corrosion with Electrode Deformation model, as expected.
Figure 4: Model geometry, electrolyte potential, and current densities at t = 0.
Figure 5 shows the current density and potential distribution in the electrolyte, the changed geometry due to metal dissolution and corrosion product deposited region at the end of the simulation. Because the electrode current densities are highest at the contact point of the metals, the metal dissolution is also maximum at this point. A streamline plot of electrolyte current density vector at the end of simulations is slightly different than that reported in Figure 4 of Galvanic Corrosion with Electrode Deformation model. The difference in the electrolyte current density streamline plot is apparent in the corrosion product deposited region where streamlines are found to change the shape.
Figure 5: Model geometry, electrolyte potential, and current densities after 72 h.
Reference
1. W. Sun, G. Liu, L. Wang, T. Wu and Y. Liu, “An arbitrary Lagrangian-Eulerian model for studying the influences of corrosion product deposition on bimetallic corrosion”, J Solid State Electrochem, vol. 17, pp. 829–840, 2013.
Application Library path: Corrosion_Module/Galvanic_Corrosion/under_deposit_corrosion
Modeling Instructions
Root
1
From the File menu, choose Open.
2
Component 1 (comp1)
Add Transport of Diluted Species and Level Set interfaces to solve for the mass transport of Mg2+ and OH ions and to track the position of the Mg(OH)2 corrosion product precipitate, respectively.
Add Physics
1
In the Home toolbar, click  Add Physics to open the Add Physics window.
2
Go to the Add Physics window.
3
In the tree, select Chemical Species Transport>Transport of Diluted Species (tds).
4
Click to expand the Dependent Variables section. In the Number of species text field, type 2.
5
In the Concentrations table, enter the following settings:
6
Click Add to Selection in the window toolbar.
7
In the tree, select Mathematics>Moving Interface>Level Set (ls).
8
Click Add to Selection in the window toolbar.
9
In the Home toolbar, click  Add Physics to close the Add Physics window.
Global Definitions
Start by updating the parameters required for corrosion product modeling.
Parameters 1
1
In the Model Builder window, under Global Definitions click Parameters 1.
2
In the Settings window for Parameters, locate the Parameters section.
3
Click  Load from File.
4
Definitions
Define a step function for use when defining variables for precipitation reaction rate and corrosion product velocity.
Step 1 (step1)
1
In the Home toolbar, click  Functions and choose Local>Step.
2
In the Settings window for Step, click to expand the Smoothing section.
3
In the Size of transition zone text field, type 0.001.
Variables 1
Load the model variables from a text file.
1
In the Home toolbar, click  Variables and choose Local Variables.
2
In the Settings window for Variables, locate the Variables section.
3
Click  Load from File.
4
The orange color for the variable v_corprod is caused by the undefined nonlocal general extrusion coupling.
General Extrusion 1 (genext1)
Now, define the nonlocal general extrusion coupling.
1
In the Definitions toolbar, click  Nonlocal Couplings and choose General Extrusion.
2
In the Settings window for General Extrusion, locate the Source Selection section.
3
From the Geometric entity level list, choose Boundary.
4
5
Locate the Destination Map section. Clear the y-expression text field.
6
Locate the Source section. From the Source frame list, choose Mesh  (Xm, Ym, Zm).
7
Select the Use source map check box.
8
Clear the Ymi-expression text field.
9
Click to expand the Advanced section. From the Mesh search method list, choose Closest point.
Transport of Diluted Species (tds)
Next, set up mass transport physics.
1
In the Model Builder window, under Component 1 (comp1) click Transport of Diluted Species (tds).
2
In the Settings window for Transport of Diluted Species, locate the Transport Mechanisms section.
3
Clear the Convection check box.
4
Select the Migration in electric field check box.
5
Transport Properties 1
1
In the Model Builder window, under Component 1 (comp1)>Transport of Diluted Species (tds) click Transport Properties 1.
2
In the Settings window for Transport Properties, locate the Diffusion section.
3
In the DcMg text field, type DMg*ls.Vf2+DMge*ls.Vf1.
4
In the DcOH text field, type DOH*ls.Vf2+DOHe*ls.Vf1.
5
Locate the Migration in Electric Field section. In the V text field, type phil.
6
In the zcMg text field, type 2.
7
In the zcOH text field, type -1.
Initial Values 1
1
In the Model Builder window, click Initial Values 1.
2
In the Settings window for Initial Values, locate the Initial Values section.
3
In the cOH text field, type cOH0.
Reactions 1
Use a Reactions node to define the sink terms for Mg2+ and OH. The use of the variable ls.delta ensures that the sink term is applied only at the corrosion product interface.
1
In the Physics toolbar, click  Domains and choose Reactions.
2
3
In the Settings window for Reactions, locate the Reaction Rates section.
4
In the RcMg text field, type -R_Mg*ls.delta.
5
In the RcOH text field, type -R_OH*ls.delta.
Concentration 1
Define the concentration at the top boundaries of the domain.
1
In the Physics toolbar, click  Boundaries and choose Concentration.
2
3
In the Settings window for Concentration, locate the Concentration section.
4
Select the Species cOH check box.
5
In the c0,cOH text field, type cOH0.
Electrode Surface Coupling 1
Now, define the source terms for Mg2+ and OH at the anode and cathode boundaries, respectively, making use of the local current densities obtained from the Secondary Current Distribution interface.
1
In the Physics toolbar, click  Boundaries and choose Electrode Surface Coupling.
2
Reaction Coefficients 1
1
In the Model Builder window, expand the Electrode Surface Coupling 1 node, then click Reaction Coefficients 1.
2
In the Settings window for Reaction Coefficients, locate the Model Inputs section.
3
From the iloc list, choose Local current density, Electrode Reaction 1 (cd/es1/er1).
4
Locate the Stoichiometric Coefficients section. In the n text field, type 4.
5
In the νcOH text field, type 4.
Electrode Surface Coupling 2
1
In the Physics toolbar, click  Boundaries and choose Electrode Surface Coupling.
2
Reaction Coefficients 1
1
In the Model Builder window, expand the Electrode Surface Coupling 2 node, then click Reaction Coefficients 1.
2
In the Settings window for Reaction Coefficients, locate the Model Inputs section.
3
From the iloc list, choose Local current density, Electrode Reaction 1 (cd/es2/er1).
4
Locate the Stoichiometric Coefficients section. In the n text field, type 2.
5
In the νcMg text field, type -1.
Level Set (ls)
Now, set up the level set physics to track the position of the corrosion product interface.
1
In the Model Builder window, under Component 1 (comp1) click Level Set (ls).
2
Level Set Model 1
1
In the Model Builder window, under Component 1 (comp1)>Level Set (ls) click Level Set Model 1.
2
In the Settings window for Level Set Model, locate the Level Set Model section.
3
In the γ text field, type max(vn_corprod,eps).
4
In the εls text field, type ls.hmax/4.
5
Locate the Convection section. Specify the u vector as
Note that the variables u_corprod and v_corprod use the step function variables defined in terms of the level set function to ensure that only the level sets adjacent to the corrosion product are advected.
Initial Values 1
1
In the Model Builder window, click Initial Values 1.
2
In the Settings window for Initial Values, locate the Initial Values section.
3
Click the Fluid 2 (ϕ = 1) button.
Inlet 1
Set the inlet for level set function.
1
In the Physics toolbar, click  Boundaries and choose Inlet.
2
In the Settings window for Inlet, locate the Boundary Selection section.
3
Click  Paste Selection.
4
In the Paste Selection dialog box, type 2,4,5 in the Selection text field.
5
Outlet 1
Set the outlet for level set function.
1
In the Physics toolbar, click  Boundaries and choose Outlet.
2
Secondary Current Distribution (cd)
Finally, define the electrolyte conductivity in terms of the level set function to prescribe a different value for the corrosion product.
Electrolyte 1
1
In the Model Builder window, expand the Secondary Current Distribution (cd) node, then click Electrolyte 1.
2
In the Settings window for Electrolyte, locate the Electrolyte section.
3
In the σl text field, type sigma*ls.Vf2+sigmae*ls.Vf1.
Component 1 (comp1)
Now, refine the mesh at the magnesium and steel boundaries.
In the Model Builder window, expand the Component 1 (comp1)>Meshes node.
Mesh 1
Size
1
In the Model Builder window, expand the Component 1 (comp1)>Meshes>Mesh 1 node.
2
Right-click Mesh 1 and choose Edit Physics-Induced Sequence.
3
In the Settings window for Size, locate the Element Size section.
4
From the Calibrate for list, choose Fluid dynamics.
5
From the Predefined list, choose Finer.
Size 1
1
In the Model Builder window, click Size 1.
2
In the Settings window for Size, locate the Element Size section.
3
From the Calibrate for list, choose Fluid dynamics.
Size 1
1
In the Model Builder window, right-click Free Triangular 1 and choose Size.
2
In the Settings window for Size, locate the Geometric Entity Selection section.
3
From the Geometric entity level list, choose Boundary.
4
5
Locate the Element Size section. From the Calibrate for list, choose Fluid dynamics.
6
From the Predefined list, choose Extremely fine.
7
In the Model Builder window, right-click Mesh 1 and choose Build All.
The mesh should look like this:
Study 1
Before computing the solution, some solver settings need to be modified.
Step 1: Current Distribution Initialization
1
In the Model Builder window, expand the Study 1 node, then click Step 1: Current Distribution Initialization.
2
In the Settings window for Current Distribution Initialization, locate the Physics and Variables Selection section.
3
In the table, clear the Solve for check boxes for Deformed Geometry (dg), Transport of Diluted Species (tds), and Level Set (ls).
4
In the table, clear the Solve for check boxes for Nondeforming Boundary 1 (ndb1) and Deforming Electrode Surface 1 (des1).
5
In the Home toolbar, click  Compute.
Results
Some plots are added by default. To reproduce the plots from the Results and Discussion section, follow the instructions below.
Streamline 1
1
In the Model Builder window, expand the Electrolyte Potential (cd) node, then click Streamline 1.
2
In the Settings window for Streamline, locate the Streamline Positioning section.
3
In the Separating distance text field, type 0.035.
4
Locate the Coloring and Style section. Find the Point style subsection. From the Arrow length list, choose Normalized.
Electrolyte Potential (cd)
In the Model Builder window, click Electrolyte Potential (cd).
Surface 2
1
In the Electrolyte Potential (cd) toolbar, click  Surface.
2
In the Settings window for Surface, locate the Expression section.
3
In the Expression text field, type 1.
4
Locate the Coloring and Style section. From the Coloring list, choose Uniform.
5
From the Color list, choose Gray.
Filter 1
1
In the Electrolyte Potential (cd) toolbar, click  Filter.
2
In the Settings window for Filter, locate the Element Selection section.
3
In the Logical expression for inclusion text field, type ls.Vf1>=0.5.
Electrolyte Potential (cd)
1
In the Model Builder window, click Electrolyte Potential (cd).
2
In the Electrolyte Potential (cd) toolbar, click  Plot.
The plot should look like Figure 5.
3
The plot should look like Figure 4.
Line Graph 1
To reproduce Figure 3 follow the instructions below.
1
In the Model Builder window, click Line Graph 1.
2
In the Settings window for Line Graph, locate the Data section.
3
From the Time selection list, choose From list.
4
In the Times (s) list, select 0.
Local Current Density Change
1
In the Model Builder window, under Results click 1D Plot Group 5.
2
In the Settings window for 1D Plot Group, type Local Current Density Change in the Label text field.
3
In the Local Current Density Change toolbar, click  Plot.
Corrosion Product Interface
Follow the instructions below to reproduce Figure 2.
1
In the Home toolbar, click  Add Plot Group and choose 2D Plot Group.
2
In the Settings window for 2D Plot Group, type Corrosion Product Interface in the Label text field.
3
Locate the Data section. From the Dataset list, choose Study 1/Remeshed Solution 1 (sol3).
4
From the Time (s) list, choose 2.3705E5.
Surface 1
1
In the Corrosion Product Interface toolbar, click  Surface.
2
In the Settings window for Surface, click Replace Expression in the upper-right corner of the Expression section. From the menu, choose Component 1 (comp1)>Level Set>ls.Vf1 - Volume fraction of fluid 1.
3
In the Corrosion Product Interface toolbar, click  Plot.
Corrosion Product Interface
In the Model Builder window, click Corrosion Product Interface.
Contour 1
1
In the Corrosion Product Interface toolbar, click  Contour.
2
In the Settings window for Contour, click Replace Expression in the upper-right corner of the Expression section. From the menu, choose Component 1 (comp1)>Level Set>ls.Vf1 - Volume fraction of fluid 1.
3
Locate the Levels section. From the Entry method list, choose Levels.
4
In the Levels text field, type 0.5.
5
Locate the Coloring and Style section. From the Coloring list, choose Uniform.
6
From the Color list, choose Black.
7
In the Corrosion Product Interface toolbar, click  Plot.
8
Click the  Zoom Extents button in the Graphics toolbar.