PDF

Separation Through Dialysis
Introduction
Dialysis is a widely used separation method. An example is hemodialysis, where membranes are used as artificial kidneys for people with renal failure. Other applications include the recovery of caustic colloidal hemicellulose during viscose manufacturing as well as the removal of alcohol from beer (Ref. 1).
In the dialysis process specific components are preferentially transported through a membrane. The process is diffusion-driven, that is, components diffuse through a membrane due to concentration differences between the dialysate and the permeate sides of the membrane. Separation between solutes is achieved as a result of the different diffusion rates across the membrane, which arise from differences in molecular size and solubility.
This example examines a process aimed at lowering the concentration of a contaminant component in an aqueous product stream. The dialysis equipment is made of a hollow fiber module, where a large number of hollow fibers act as the membrane. It focuses on the transport of the contaminant in the hollow fiber and through its wall.
Figure 1 shows a diagram of the hollow fiber assembly within a dialysis module where the dialysate flows inside while the permeate flows on the outside in a co-current manner. The contaminant is transported through the fiber walls to the permeate side. Species with a higher molecular weight are retained in the dialysate side, due to their low solubility and diffusivity through the membrane.
Figure 1: The hollow fiber assembly in a dialysis module.
Model Definition
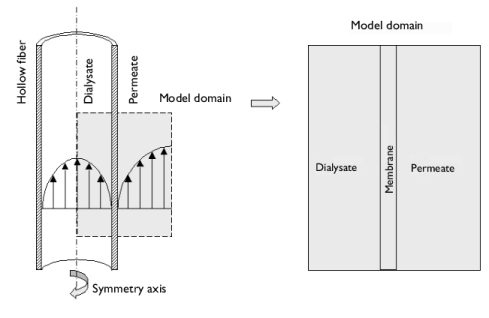
This example models a piece of hollow fiber through which the dialysate flows with a fully developed laminar parabolic velocity profile. The fiber is surrounded by a permeate that flows laminarly in the same direction as the dialysate.The dialysate, the permeate, and the membrane are all examined in the results. The model domain is shown in Figure 2.Here, the angular gradients are considered negligible, so an axisymmetrical approximation can be used.
Figure 2: Illustrations of the hollow fiber setup with the dialysate and permeate, and of the model domain.
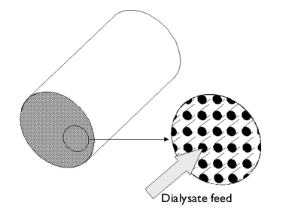
You can draw a hexagonal-shaped unit cell of the fiber assembly as in Figure 3:
Figure 3: Hexagonal-shaped unit cell of the fiber assembly.
As a simplification, the hexagon is approximated as a circle in the model.
The contaminant is transported by diffusion and convection within the two liquids, whereas diffusion is the only transport mechanism through the membrane. The mass transport is modeled with the Transport of Diluted Species interface. To analyze the convective flux, the Laminar Flow interface is utilized, assuming that the flow is laminar.
The contaminant must dissolve into the membrane in order to be transported through it. The interface conditions between the liquids and the membrane are described by the dimensionless partition coefficient K:
(1)
where ci denotes the concentration of the contaminant (SI unit: mol/m3). The subscripts and superscripts describe the location in the dialysis fiber as displayed in Figure 4. This figure also shows a schematic concentration profile.
Figure 4: The concentration profile across the membrane (see Equation 1). Note that there are discontinuities in the concentration profile at the membrane boundaries.
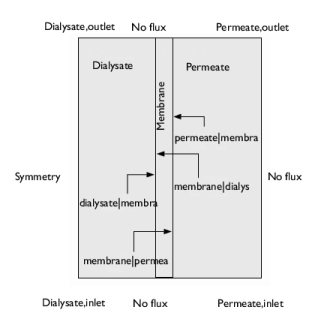
To obtain a well-posed problem, an appropriate set of boundary conditions must be defined. Figure 5 displays the boundaries that need to be accounted for. Note that the concentration is discontinuous at the membrane-liquid interfaces; boundary conditions need to be set on both sides of the interface. Equation 1 is implemented at each of the two boundaries using a Partition Condition node. In addition to prescribing the concentration ratio, this node ensures that the mass flux is identical on both sides of the interface.
Figure 5: The boundaries accounted for in the model.
Danckwerts’ inflow conditions are set at the inlet to the dialysate and permeate. At the outlet, the convective contribution to the mass transport is assumed to be much larger than the diffusive contribution and is modeled by setting outflow conditions. Symmetry applies at the leftmost boundary for this axisymmetrical model geometry and no flux is set at the membrane edges and the rightmost boundary, since no species pass these.
Summary of Input Data
The input data are listed in the table:
10-9 m2/s
Dm
10-9 m2/s
Rhf
Lm
Lpc
Uave_dia
Uave_per
c0
Results and Discussion
The surface plot in Figure 6 visualizes the concentration distribution throughout the three model domains in 3D: the dialysate liquid inside the hollow fiber (nearest the center), the membrane, and the permeate liquid outside the hollow fiber. As the plot shows, the concentration inside the hollow fiber decreases markedly over the first 10 mm from the inlet. The contaminant transport, starting from the dialysate inlet, is shown in detail in Figure 7. In this figure the radial direction has been rescaled for clarity. Streamlines of the total flux of the contaminant is plotted, with arrows separated by a fixed time interval. Observing the number of arrows inside the membrane, it is evident that the time for the transport across the membrane increases with the downstream distance. This occurs since the driving force, the concentration difference between the dialysate and the permeate side, decreases with the downstream direction.
Figure 6: Concentration in the three domains using a revolution dataset.
Figure 7: Contaminant development using a scaled radial direction. The total flux is visualized using streamlines of the total flux.
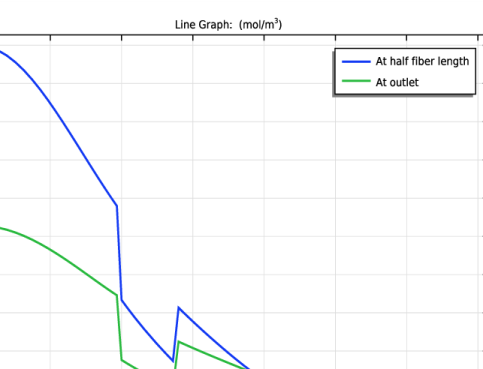
Concentration jumps arise at the boundaries between the domains. This is shown in Figure 8 where the concentration profile at the middle of the fiber length is plotted along the radius of the model geometry.
Figure 8: Concentration across the three domains at the middle of the fiber length and at the outlet.
References
1. M. Mulder, Basic Principles of Membrane Technology, 2nd ed., Kluwer Academic Publishers, 1998.
2. R.B. Bird, W.E. Stewart, and E.N. Lightfoot, Transport Phenomena, John Wiley & Sons, 1960.
Application Library path: Chemical_Reaction_Engineering_Module/Mixing_and_Separation/dialysis
Modeling Instructions
From the File menu, choose New.
New
In the New window, click  Model Wizard.
Model Wizard
1
In the Model Wizard window, click  2D Axisymmetric.
2
In the Select Physics tree, select Chemical Species Transport>Transport of Diluted Species (tds).
3
Click Add.
4
In the Select Physics tree, select Fluid Flow>Single-Phase Flow>Laminar Flow (spf).
5
Click Add.
6
Click  Study.
7
In the Select Study tree, select General Studies>Stationary.
8
Root
Load parameters from a text-file.
Global Definitions
Parameters 1
1
In the Model Builder window, under Global Definitions click Parameters 1.
2
In the Settings window for Parameters, locate the Parameters section.
3
Click  Load from File.
4
Draw the geometry and make selections.
Geometry 1
1
In the Model Builder window, under Component 1 (comp1) click Geometry 1.
2
In the Settings window for Geometry, locate the Units section.
3
From the Length unit list, choose mm.
Rectangle 1 (r1)
1
In the Geometry toolbar, click  Rectangle.
2
In the Settings window for Rectangle, locate the Size and Shape section.
3
In the Width text field, type Rhf.
4
In the Height text field, type H.
5
Click  Build Selected.
6
Click the  Zoom Extents button in the Graphics toolbar.
Rectangle 2 (r2)
1
In the Geometry toolbar, click  Rectangle.
2
In the Settings window for Rectangle, locate the Size and Shape section.
3
In the Width text field, type Lm.
4
In the Height text field, type H.
5
Locate the Position section. In the r text field, type Rhf.
6
Click  Build Selected.
7
Click the  Zoom Extents button in the Graphics toolbar.
Rectangle 3 (r3)
1
In the Geometry toolbar, click  Rectangle.
2
In the Settings window for Rectangle, locate the Size and Shape section.
3
In the Width text field, type Lpc.
4
In the Height text field, type H.
5
Locate the Position section. In the r text field, type Rhf+Lm.
6
Click  Build Selected.
7
Click the  Zoom Extents button in the Graphics toolbar.
Form Union (fin)
1
In the Model Builder window, click Form Union (fin).
2
In the Settings window for Form Union/Assembly, click  Build Selected.
Dialysate and Permeate
1
In the Geometry toolbar, click  Selections and choose Explicit Selection.
2
In the Settings window for Explicit Selection, type Dialysate and Permeate in the Label text field.
3
On the object fin, select Domains 1 and 3 only.
Membrane
1
In the Geometry toolbar, click  Selections and choose Explicit Selection.
2
In the Settings window for Explicit Selection, type Membrane in the Label text field.
3
On the object fin, select Domain 2 only.
Model transport by convection and diffusion in the dialysate and permeate, and diffusion in the membrane.
Transport of Diluted Species (tds)
Transport Properties - Dialysate and Permeate
1
In the Model Builder window, under Component 1 (comp1)>Transport of Diluted Species (tds) click Transport Properties 1.
2
In the Settings window for Transport Properties, type Transport Properties - Dialysate and Permeate in the Label text field.
3
Locate the Convection section. From the u list, choose Velocity field (spf).
4
Locate the Diffusion section. In the Dc text field, type D.
Transport Properties - Membrane
1
In the Physics toolbar, click  Domains and choose Transport Properties.
2
3
In the Settings window for Transport Properties, type Transport Properties - Membrane in the Label text field.
4
Locate the Diffusion section. In the Dc text field, type Dm.
Initial Values 1
1
In the Model Builder window, click Initial Values 1.
2
In the Settings window for Initial Values, locate the Initial Values section.
3
In the c text field, type c0_dia.
Initial Values 2
1
Right-click Component 1 (comp1)>Transport of Diluted Species (tds)>Initial Values 1 and choose Duplicate.
2
3
In the Settings window for Initial Values, locate the Initial Values section.
4
In the c text field, type c0_per.
Inflow 1
1
In the Physics toolbar, click  Boundaries and choose Inflow.
2
3
In the Settings window for Inflow, locate the Concentration section.
4
In the c0,c text field, type c0_dia.
5
Locate the Boundary Condition Type section. From the list, choose Flux (Danckwerts).
Inflow 2
1
In the Physics toolbar, click  Boundaries and choose Inflow.
2
3
In the Settings window for Inflow, locate the Concentration section.
4
In the c0,c text field, type c0_per.
5
Locate the Boundary Condition Type section. From the list, choose Flux (Danckwerts).
Outflow 1
1
In the Physics toolbar, click  Boundaries and choose Outflow.
2
Add a Partition Condition feature to implement the concentration ratio at the dialysate-membrane interface.
Partition Condition 1
1
In the Physics toolbar, click  Boundaries and choose Partition Condition.
2
3
In the Settings window for Partition Condition, locate the Partition Coefficient section.
4
In the Kc text field, type K.
Note that up and downside for the concentration are indicated in the Graphics window. The arrow, situated on the selected boundary, points from the downside into the upside. In this case let the membrane side correspond to the upside to achieve the desired condition.
Add another Partition Condition feature to implement the concentration ratio at the permeate-membrane interface.
Partition Condition 2
1
In the Physics toolbar, click  Boundaries and choose Partition Condition.
2
Use the Reverse direction check box to make the membrane side correspond to the upside also for this condition.
3
In the Settings window for Partition Condition, locate the Partition Coefficient section.
4
Select the Reverse direction check box.
5
In the Kc text field, type K.
Add Material
1
In the Home toolbar, click  Add Material to open the Add Material window.
2
Go to the Add Material window.
3
In the tree, select Liquids and Gases>Liquids>Water.
4
Click Add to Component in the window toolbar.
5
In the Home toolbar, click  Add Material to close the Add Material window.
Laminar Flow (spf)
1
In the Model Builder window, under Component 1 (comp1) click Laminar Flow (spf).
2
In the Settings window for Laminar Flow, locate the Domain Selection section.
3
From the Selection list, choose Dialysate and Permeate.
Inlet 1
1
In the Physics toolbar, click  Boundaries and choose Inlet.
2
3
In the Settings window for Inlet, locate the Boundary Condition section.
4
From the list, choose Fully developed flow.
5
Locate the Fully Developed Flow section. In the Uav text field, type Uave_dia.
Inlet 2
1
In the Physics toolbar, click  Boundaries and choose Inlet.
2
3
In the Settings window for Inlet, locate the Boundary Condition section.
4
From the list, choose Fully developed flow.
5
Locate the Fully Developed Flow section. In the Uav text field, type Uave_per.
Outlet 1
1
In the Physics toolbar, click  Boundaries and choose Outlet.
2
Mesh 1
Mapped 1
In the Mesh toolbar, click  Mapped.
Distribution 1
1
Right-click Mapped 1 and choose Distribution.
2
3
In the Settings window for Distribution, locate the Distribution section.
4
From the Distribution type list, choose Predefined.
5
In the Number of elements text field, type 250.
6
In the Element ratio text field, type 25.
Distribution 2
1
In the Model Builder window, right-click Mapped 1 and choose Distribution.
2
3
In the Settings window for Distribution, locate the Distribution section.
4
From the Distribution type list, choose Predefined.
5
In the Number of elements text field, type 7.
6
In the Element ratio text field, type 2.
7
Select the Symmetric distribution check box.
Distribution 3
1
Right-click Mapped 1 and choose Distribution.
2
3
In the Settings window for Distribution, locate the Distribution section.
4
From the Distribution type list, choose Predefined.
5
In the Number of elements text field, type 20.
6
In the Element ratio text field, type 2.
Distribution 4
1
Right-click Mapped 1 and choose Distribution.
2
3
Click the  Zoom Extents button in the Graphics toolbar.
4
5
In the Settings window for Distribution, locate the Distribution section.
6
From the Distribution type list, choose Predefined.
7
In the Number of elements text field, type 30.
8
In the Element ratio text field, type 3.
9
Select the Reverse direction check box.
Solve the model in two steps. First, the Laminar Flow interface and thereafter the Transport of Diluted Species interface.
Study 1
Step 1: Stationary
1
In the Model Builder window, under Study 1 click Step 1: Stationary.
2
In the Settings window for Stationary, locate the Physics and Variables Selection section.
3
In the table, clear the Solve for check box for Transport of Diluted Species (tds).
Stationary 2
1
In the Study toolbar, click  Study Steps and choose Stationary>Stationary.
2
In the Settings window for Stationary, locate the Physics and Variables Selection section.
3
In the table, clear the Solve for check box for Laminar Flow (spf).
4
In the Study toolbar, click  Compute.
Results
Concentration (tds)
1
Click the  Show More Options button in the Model Builder toolbar.
2
In the Show More Options dialog box, in the tree, select the check box for the node Results>Views.
3
View 2D 2
In the Model Builder window, right-click Views and choose View 2D.
Axis
1
In the Model Builder window, expand the View 2D 2 node, then click Axis.
2
In the Settings window for Axis, locate the Axis section.
3
From the View scale list, choose Manual.
4
In the x scale text field, type 25.
5
Click the  Zoom Extents button in the Graphics toolbar.
Concentration (tds)
1
In the Model Builder window, click Concentration (tds).
2
In the Settings window for 2D Plot Group, locate the Plot Settings section.
3
From the View list, choose View 2D 2.
4
In the Concentration (tds) toolbar, click  Plot.
Surface 1
1
In the Model Builder window, expand the Concentration (tds) node, then click Surface 1.
2
In the Settings window for Surface, locate the Coloring and Style section.
3
From the Color table list, choose JupiterAuroraBorealis.
4
Click the  Zoom Extents button in the Graphics toolbar.
Streamline 1
1
In the Model Builder window, click Streamline 1.
2
In the Settings window for Streamline, locate the Streamline Positioning section.
3
From the Positioning list, choose On selected boundaries.
4
In the Number text field, type 13.
5
Locate the Selection section. Select the  Activate Selection toggle button.
6
7
Locate the Coloring and Style section. Find the Point style subsection. From the Arrow distribution list, choose Equal time.
8
Select the Scale factor check box.
9
10
From the Color list, choose Custom.
11
12
Click Define custom colors.
13
14
Click Add to custom colors.
15
Click Show color palette only or OK on the cross-platform desktop.
Arrow Line 1
In the Model Builder window, right-click Concentration (tds) and choose Arrow Line.
Selection 1
1
In the Model Builder window, right-click Arrow Line 1 and choose Selection.
2
Arrow Line 1
1
In the Model Builder window, click Arrow Line 1.
2
In the Settings window for Arrow Line, click Replace Expression in the upper-right corner of the Expression section. From the menu, choose Component 1 (comp1)>Laminar Flow>Velocity and pressure>u,w - Velocity field.
3
Locate the Arrow Positioning section. In the Number of arrows text field, type 39.
4
Locate the Coloring and Style section. Select the Scale factor check box.
5
6
In the Concentration (tds) toolbar, click  Plot.
Concentration 2D Revolution
1
In the Model Builder window, under Results click Concentration, 3D (tds).
2
In the Settings window for 3D Plot Group, type Concentration 2D Revolution in the Label text field.
3
Locate the Plot Settings section. Clear the Plot dataset edges check box.
Surface 1
1
In the Model Builder window, expand the Concentration 2D Revolution node, then click Surface 1.
2
In the Settings window for Surface, locate the Coloring and Style section.
3
From the Color table list, choose JupiterAuroraBorealis.
If necessary, the view angle of the plot can be adjusted with the mouse.
Concentration 2D Revolution
1
Click the  Zoom Extents button in the Graphics toolbar.
2
In the Model Builder window, click Concentration 2D Revolution.
3
In the Concentration 2D Revolution toolbar, click  Plot.
Surface
1
In the Model Builder window, expand the Velocity (spf) node, then click Surface.
2
In the Settings window for Surface, locate the Coloring and Style section.
3
From the Color table list, choose Wave.
Visualize the pressure contours in the dialysate and permeate separately.
Selection 1
1
In the Model Builder window, expand the Pressure (spf) node.
2
Right-click Contour and choose Selection.
3
Contour
1
In the Model Builder window, click Contour.
2
In the Settings window for Contour, locate the Levels section.
3
In the Total levels text field, type 20.
Contour 2
Right-click Contour and choose Duplicate.
Selection 1
1
In the Model Builder window, expand the Contour 2 node, then click Selection 1.
2
In the Settings window for Selection, locate the Selection section.
3
Click  Clear Selection.
4
5
In the Pressure (spf) toolbar, click  Plot.
6
Click the  Zoom Extents button in the Graphics toolbar.
Velocity 2D Revolution
1
In the Model Builder window, under Results click Velocity, 3D (spf).
2
In the Settings window for 3D Plot Group, type Velocity 2D Revolution in the Label text field.
Surface
1
In the Model Builder window, expand the Velocity 2D Revolution node, then click Surface.
2
In the Settings window for Surface, locate the Coloring and Style section.
3
From the Color table list, choose Wave.
Create cut lines at two locations along the fiber length to illustrate the concentration jump between the domains in Figure 8.
Cut Line 2D 1
1
In the Results toolbar, click  Cut Line 2D.
2
In the Settings window for Cut Line 2D, locate the Line Data section.
3
In row Point 1, set z to H/2.
4
In row Point 2, set r to Rhf+Lm+Lpc and z to H/2.
Cut Line 2D 2
1
In the Results toolbar, click  Cut Line 2D.
2
In the Settings window for Cut Line 2D, locate the Line Data section.
3
In row Point 1, set z to H.
4
In row Point 2, set r to Rhf+Lm+Lpc and z to H.
Concentration Jump
1
In the Results toolbar, click  1D Plot Group.
2
In the Settings window for 1D Plot Group, type Concentration Jump in the Label text field.
At H/2
1
Right-click Concentration Jump and choose Line Graph.
2
In the Settings window for Line Graph, type At H/2 in the Label text field.
3
Locate the Data section. From the Dataset list, choose Cut Line 2D 1.
4
Locate the x-Axis Data section. From the Parameter list, choose Expression.
5
In the Expression text field, type r.
6
Click to expand the Coloring and Style section. In the Width text field, type 2.
7
Click to expand the Legends section. Select the Show legends check box.
8
From the Legends list, choose Manual.
9
At H
1
In the Model Builder window, right-click Concentration Jump and choose Line Graph.
2
In the Settings window for Line Graph, type At H in the Label text field.
3
Locate the Data section. From the Dataset list, choose Cut Line 2D 2.
4
Click to expand the Title section. From the Title type list, choose None.
5
Locate the x-Axis Data section. From the Parameter list, choose Expression.
6
In the Expression text field, type r.
7
Locate the Coloring and Style section. In the Width text field, type 2.
8
Locate the Legends section. Select the Show legends check box.
9
From the Legends list, choose Manual.
10
11
In the Concentration Jump toolbar, click  Plot.