PDF

Battery Over-Discharge Protection Using Shunt Resistances
Introduction
When integrating battery cells into packs, additional circuit components may be added for handling cell-to-cell balancing and overcharge/discharge protection. This tutorial demonstrates how to investigate the dynamics of battery cells when integrated with electronics.
The tutorial defines a small circuit of two lithium-ion batteries connected in series (2s configuration). After some time of operation, one of the batteries is assumed to start discharging at a higher rate due to a small internal short circuit, resulting in an uneven discharge/balance of the batteries, and, in the end, over discharge. To mitigate the risk of over discharge, the electrical circuit is then modified by introducing additional shunt resistances coupled in parallel to the batteries, and switching logics.
Model Definition
The model is set up in 0D. The Electrical Circuit interface is used to define the circuit, consisting of a current source, a resistive load and the two shunt resistances. The batteries are connected to the electrical circuit by using External I versus U nodes.
Figure 1: Circuit diagram used in the over-discharge protection circuit.
The battery cells are defined using the Lumped Battery Interface (one instance per battery cell), using the Circuit Voltage Source operation mode. The two lumped battery models are identical apart from a Short Circuit node added to Cell 1. The short circuiting of cell 2 starts after 50 s.
The switching logics for the shunt resistances is set up using the Events interface.
Table 1. lists the values of the event based shunt resistances used in the model.
The two different variants of the model is simulated. In Study 1 the model is solved without the event-triggered shunts, whereas in Study 2 the shunts are active.
Results and Discussion
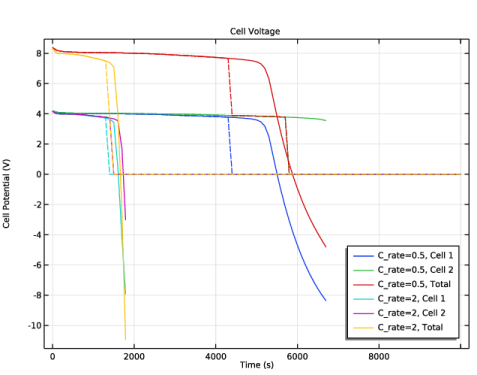
Figure 2 shows the cell voltages for the different batteries in operation and of the voltmeter across the series connection for Study 1 (without shunts) and Study 2 (with shunts). The dashed lines show sharp dips in the respective voltages for the individual cells when the events monitoring the SOC levels are triggered, and the cells begin to discharge through the respective shunt resistors in coupled in parallel to the batteries.
Figure 2: Cell voltages for lumped batteries and the measurement across the voltmeter. Solid lines represent the case when not using shunts, and the dashed lines the case using active shunts.
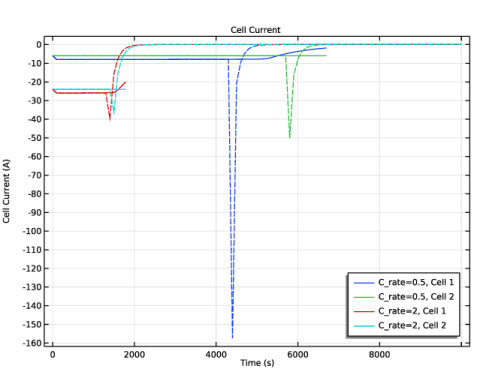
Figure 3 shows the corresponding cell currents for the two batteries. The magnitude of the current drawn from each cell at the moment the shunts are triggered depends on the C-rate.
Figure 3: Cell current of the two batteries at different C-rates. Solid lines represent the case when not using shunts, and the dashed lines the case using active shunts.
Figure 4: State-of-charge for the batteries at different C-rates.Solid lines represent the case when not using shunts, and the dashed lines the case using active shunts.
Figure 4 shows the state-of-charge for various C-rates. The plot shows that for the system managed using the shunt triggering electronics, both the batteries end up at zero equal SOCs after the discharge operation, however for system without shunt resistors, the system ends up at a situation with over-discharged and one under-utilized battery.
Reference
1. G.L. Plett, “Battery Pack Balancing and Power Estimation: Algorithms for Battery Management Systems Specialization”; https://www.coursera.org/lecture/battery-pack-balancing-power-estimation/5-1-1-welcome-to-the-course-GWDVt.
Application Library path: Battery_Design_Module/Batteries,_General/over_discharge_protection
Modeling Instructions
From the File menu, choose New.
New
In the New window, click  Model Wizard.
Model Wizard
1
In the Model Wizard window, click  0D.
2
In the Select Physics tree, select Electrochemistry>Batteries>Lumped Battery (lb).
3
Click Add.
4
In the Select Physics tree, select Electrochemistry>Batteries>Lumped Battery (lb).
5
Click Add.
6
In the Select Physics tree, select AC/DC>Electrical Circuit (cir).
7
Click Add.
8
Click  Study.
9
In the Select Study tree, select General Studies>Time Dependent.
10
Global Definitions
Add the parameter file required for setting up the physics of the Lumped Battery and the Electrical Circuit interfaces.
Parameters 1
1
In the Model Builder window, under Global Definitions click Parameters 1.
2
In the Settings window for Parameters, locate the Parameters section.
3
Click  Load from File.
4
Definitions
Add a step function to define the short circuit initialization at the Lumped Battery at a given time.
Short
1
In the Home toolbar, click  Functions and choose Local>Step.
2
In the Settings window for Step, type Short in the Label text field.
E_OCP
Next add interpolation functions to define the SOC dependent equilibrium potential.
1
In the Home toolbar, click  Functions and choose Local>Interpolation.
2
In the Settings window for Interpolation, type E_OCP in the Label text field.
3
Locate the Definition section. From the Data source list, choose File.
4
In the Filename text field, type over_discharge_protection_E_OCP.txt.
5
Click Import.
6
Locate the Interpolation and Extrapolation section. From the Extrapolation list, choose Nearest function.
7
Locate the Units section. In the Arguments text field, type 1.
8
In the Function text field, type V.
Lumped Battery (lb)
Start setting the Lumped Battery interface below.
1
In the Model Builder window, under Component 1 (comp1) click Lumped Battery (lb).
2
In the Settings window for Lumped Battery, locate the Operation Mode section.
3
From the Operation mode list, choose Circuit voltage source.
4
Locate the Battery Settings section. In the Qcell,0 text field, type Q_cell0.
5
In the SOCcell,0 text field, type SOC_0.
Cell Equilibrium Potential 1
1
In the Model Builder window, under Component 1 (comp1)>Lumped Battery (lb) click Cell Equilibrium Potential 1.
2
In the Settings window for Cell Equilibrium Potential, locate the Open Circuit Voltage section.
3
From the Open circuit voltage input list, choose From definitions.
4
From the EOCV,ref list, choose E_OCP (int1).
Voltage Losses 1
1
In the Model Builder window, click Voltage Losses 1.
2
In the Settings window for Voltage Losses, locate the Ohmic Overpotential section.
3
In the ηIR,1C text field, type eta_IR_1C.
4
Locate the Activation Overpotential section. In the J0 text field, type J0.
5
Locate the Concentration Overpotential section. Select the Include concentration overpotential check box.
6
In the τ text field, type tau.
Short Circuit 1
1
In the Physics toolbar, click  Global and choose Short Circuit.
2
In the Settings window for Short Circuit, locate the Short Circuit Conductance section.
3
In the Gshort text field, type G_short*step1((t-t_short_start)/1[s]).
Lumped Battery 2 (lb2)
Set up the second battery in a similar manner, except for the short circuit node.
1
In the Model Builder window, under Component 1 (comp1) click Lumped Battery 2 (lb2).
2
In the Settings window for Lumped Battery, locate the Operation Mode section.
3
From the Operation mode list, choose Circuit voltage source.
4
Locate the Battery Settings section. In the Qcell,0 text field, type Q_cell0.
5
In the SOCcell,0 text field, type SOC_0.
Cell Equilibrium Potential 1
1
In the Model Builder window, under Component 1 (comp1)>Lumped Battery 2 (lb2) click Cell Equilibrium Potential 1.
2
In the Settings window for Cell Equilibrium Potential, locate the Open Circuit Voltage section.
3
From the Open circuit voltage input list, choose From definitions.
4
From the EOCV,ref list, choose E_OCP (int1).
Voltage Losses 1
1
In the Model Builder window, click Voltage Losses 1.
2
In the Settings window for Voltage Losses, locate the Ohmic Overpotential section.
3
In the ηIR,1C text field, type eta_IR_1C.
4
Locate the Activation Overpotential section. In the J0 text field, type J0.
5
Locate the Concentration Overpotential section. Select the Include concentration overpotential check box.
6
In the τ text field, type tau.
Electrical Circuit (cir)
Now move on to set the circuit through which the batteries are discharged in a 2s configuration as described below:
In the Model Builder window, under Component 1 (comp1) click Electrical Circuit (cir).
Current Source 1 (I1)
1
In the Electrical Circuit toolbar, click  Current Source.
2
In the Settings window for Current Source, locate the Node Connections section.
3
4
Locate the Device Parameters section. In the isrc text field, type I_app.
Lumped Battery 1
1
In the Electrical Circuit toolbar, click  External I vs. U.
2
In the Settings window for External I vs. U, type Lumped Battery 1 in the Label text field.
3
Locate the Node Connections section. In the table, enter the following settings:
4
Locate the External Device section. From the V list, choose Electric potential on circuit (lb/vl1).
Lumped Battery 2
1
Right-click Lumped Battery 1 and choose Duplicate.
2
In the Settings window for External I vs. U, type Lumped Battery 2 in the Label text field.
3
Locate the Node Connections section. In the table, enter the following settings:
4
Locate the External Device section. From the V list, choose Electric potential on circuit (lb2/vl1).
Resistor 1 (R1)
1
In the Electrical Circuit toolbar, click  Resistor.
2
In the Settings window for Resistor, locate the Node Connections section.
3
4
Locate the Device Parameters section. In the R text field, type 10[m[Omega]].
Volt Meter 1 (vm1)
1
In the Electrical Circuit toolbar, click  Volt Meter.
2
In the Settings window for Volt Meter, locate the Node Connections section.
3
Study 1: Without Shunts
1
In the Model Builder window, click Study 1.
2
In the Settings window for Study, type Study 1: Without Shunts in the Label text field.
3
Locate the Study Settings section. Clear the Generate default plots check box.
Step 1: Time Dependent
1
In the Model Builder window, under Study 1: Without Shunts click Step 1: Time Dependent.
2
In the Settings window for Time Dependent, locate the Study Settings section.
3
In the Output times text field, type range(0,100,10000).
4
Click to expand the Study Extensions section. Select the Auxiliary sweep check box.
5
From the Sweep type list, choose All combinations.
6
7
Solution 1 (sol1)
1
In the Study toolbar, click  Show Default Solver.
2
In the Model Builder window, expand the Solution 1 (sol1) node.
3
In the Model Builder window, expand the Study 1: Without Shunts>Solver Configurations>Solution 1 (sol1)>Time-Dependent Solver 1 node.
4
Right-click Time-Dependent Solver 1 and choose Stop Condition.
5
In the Settings window for Stop Condition, locate the Stop Expressions section.
6
7
8
In the Study toolbar, click  Compute.
Results
Cell Voltage
1
In the Home toolbar, click  Add Plot Group and choose 1D Plot Group.
2
In the Settings window for 1D Plot Group, type Cell Voltage in the Label text field.
3
Locate the Data section. From the Dataset list, choose None.
4
Click to expand the Title section. From the Title type list, choose Label.
5
Locate the Plot Settings section. Select the y-axis label check box.
6
7
Locate the Legend section. From the Position list, choose Lower right.
Global 1
1
Right-click Cell Voltage and choose Global.
2
In the Settings window for Global, locate the Data section.
3
From the Dataset list, choose Study 1: Without Shunts/Solution 1 (sol1).
4
Click Add Expression in the upper-right corner of the y-Axis Data section. From the menu, choose Component 1 (comp1)>Lumped Battery>lb.E_cell - Cell potential - V.
5
Locate the y-Axis Data section. In the table, enter the following settings:
6
Click Add Expression in the upper-right corner of the y-Axis Data section. From the menu, choose Component 1 (comp1)>Lumped Battery 2>lb2.E_cell - Cell potential - V.
7
Locate the y-Axis Data section. In the table, enter the following settings:
8
Click Add Expression in the upper-right corner of the y-Axis Data section. From the menu, choose Component 1 (comp1)>Electrical Circuit>Measurements>cir.vm1.v - Voltage across Volt meter # - V.
9
Locate the y-Axis Data section. In the table, enter the following settings:
10
Click to expand the Coloring and Style section. From the Color list, choose Cycle (reset).
11
In the Cell Voltage toolbar, click  Plot.
Cell Current
1
In the Model Builder window, right-click Cell Voltage and choose Duplicate.
2
In the Settings window for 1D Plot Group, type Cell Current in the Label text field.
3
Locate the Plot Settings section. In the y-axis label text field, type Cell Current (A).
Global 1
1
In the Model Builder window, expand the Cell Current node, then click Global 1.
2
In the Settings window for Global, locate the y-Axis Data section.
3
Click  Clear Table.
4
Click Replace Expression in the upper-right corner of the y-Axis Data section. From the menu, choose Component 1 (comp1)>Lumped Battery>lb.I_cell - Cell current - A.
5
Locate the y-Axis Data section. In the table, enter the following settings:
6
Click Add Expression in the upper-right corner of the y-Axis Data section. From the menu, choose Component 1 (comp1)>Lumped Battery 2>lb2.I_cell - Cell current - A.
7
Locate the y-Axis Data section. In the table, enter the following settings:
8
In the Cell Current toolbar, click  Plot.
State-Of-Charge
1
In the Home toolbar, click  Add Plot Group and choose 1D Plot Group.
2
In the Settings window for 1D Plot Group, type State-Of-Charge in the Label text field.
3
Locate the Data section. From the Dataset list, choose None.
4
Locate the Title section. From the Title type list, choose Label.
5
Locate the Plot Settings section. Select the y-axis label check box.
6
Global 1
1
Right-click State-Of-Charge and choose Global.
2
In the Settings window for Global, locate the Data section.
3
From the Dataset list, choose Study 1: Without Shunts/Solution 1 (sol1).
4
Click Add Expression in the upper-right corner of the y-Axis Data section. From the menu, choose Component 1 (comp1)>Lumped Battery>lb.SOC_cell - Cell state-of-charge.
5
Locate the y-Axis Data section. In the table, enter the following settings:
6
Click Add Expression in the upper-right corner of the y-Axis Data section. From the menu, choose Component 1 (comp1)>Lumped Battery 2>lb2.SOC_cell - Cell state-of-charge.
7
Locate the y-Axis Data section. In the table, enter the following settings:
8
Locate the Coloring and Style section. From the Color list, choose Cycle (reset).
9
In the State-Of-Charge toolbar, click  Plot.
The next set of instructions will modify the model to include an event based circuit, wherein the shunt resistors are plugged in or out depending on the discharge states of the batteries.
Add Physics
1
In the Home toolbar, click  Add Physics to open the Add Physics window.
2
Go to the Add Physics window.
3
In the tree, select Mathematics>ODE and DAE Interfaces>Events (ev).
4
Click Add to Component 1 in the window toolbar.
5
In the Home toolbar, click  Add Physics to close the Add Physics window.
Events (ev)
Discrete States 1
1
Right-click Component 1 (comp1)>Events (ev) and choose Discrete States.
2
In the Settings window for Discrete States, locate the Discrete States section.
3
Indicator States 1
1
In the Events toolbar, click  Indicator States.
2
In the Settings window for Indicator States, locate the Indicator Variables section.
3
Implicit Event 1
1
In the Events toolbar, click  Implicit Event.
2
In the Settings window for Implicit Event, locate the Event Conditions section.
3
In the Condition text field, type discharge_lb_1<0.
4
Locate the Reinitialization section. In the table, enter the following settings:
Implicit Event 2
1
Right-click Implicit Event 1 and choose Duplicate.
2
In the Settings window for Implicit Event, locate the Event Conditions section.
3
In the Condition text field, type discharge_lb_2<0.
4
Locate the Reinitialization section. In the table, enter the following settings:
Electrical Circuit (cir)
In the Model Builder window, under Component 1 (comp1) click Electrical Circuit (cir).
Shunt R1
1
In the Electrical Circuit toolbar, click  Resistor.
2
In the Settings window for Resistor, type Shunt R1 in the Label text field.
3
Locate the Device Parameters section. In the R text field, type R1*Shunt_R1_on.
4
Locate the Node Connections section. In the table, enter the following settings:
Shunt R2
1
Right-click Shunt R1 and choose Duplicate.
2
In the Settings window for Resistor, type Shunt R2 in the Label text field.
3
Locate the Node Connections section. In the table, enter the following settings:
4
Locate the Device Parameters section. In the R text field, type R1*Shunt_R2_on.
Add Study
1
In the Home toolbar, click  Add Study to open the Add Study window.
2
Go to the Add Study window.
3
Find the Studies subsection. In the Select Study tree, select General Studies>Time Dependent.
4
Click Add Study in the window toolbar.
5
In the Home toolbar, click  Add Study to close the Add Study window.
Study 2: With Shunts
1
In the Model Builder window, click Study 2.
2
In the Settings window for Study, type Study 2: With Shunts in the Label text field.
Step 1: Time Dependent
1
In the Model Builder window, under Study 2: With Shunts click Step 1: Time Dependent.
2
In the Settings window for Time Dependent, locate the Study Settings section.
3
In the Output times text field, type range(0,100,10000).
4
Locate the Study Extensions section. Select the Auxiliary sweep check box.
5
6
7
In the Model Builder window, click Study 2: With Shunts.
8
In the Settings window for Study, locate the Study Settings section.
9
Clear the Generate default plots check box.
10
In the Home toolbar, click  Compute.
Results
Cell Voltage
1
In the Model Builder window, under Results click Cell Voltage.
2
In the Cell Voltage toolbar, click  Plot.
Global 2
1
In the Model Builder window, under Results>Cell Voltage right-click Global 1 and choose Duplicate.
2
In the Settings window for Global, locate the Data section.
3
From the Dataset list, choose Study 2: With Shunts/Solution 2 (sol2).
4
Locate the Coloring and Style section. Find the Line style subsection. From the Line list, choose Dashed.
5
Click to expand the Legends section. Clear the Show legends check box.
6
Click the  Zoom Extents button in the Graphics toolbar.
7
In the Cell Voltage toolbar, click  Plot.
Global 2
1
In the Model Builder window, under Results>Cell Current right-click Global 1 and choose Duplicate.
2
In the Settings window for Global, locate the Data section.
3
From the Dataset list, choose Study 2: With Shunts/Solution 2 (sol2).
4
Locate the Coloring and Style section. Find the Line style subsection. From the Line list, choose Dashed.
5
Locate the Legends section. Clear the Show legends check box.
6
Click the  Zoom Extents button in the Graphics toolbar.
Global 2
1
In the Model Builder window, under Results>State-Of-Charge right-click Global 1 and choose Duplicate.
2
In the Settings window for Global, locate the Data section.
3
From the Dataset list, choose Study 2: With Shunts/Solution 2 (sol2).
4
Locate the Coloring and Style section. Find the Line style subsection. From the Line list, choose Dashed.
5
Locate the Legends section. Clear the Show legends check box.
6
Click the  Zoom Extents button in the Graphics toolbar.
7
In the State-Of-Charge toolbar, click  Plot.