You are viewing the documentation for an older COMSOL version. The latest version is available here.
PDF

Aging Analysis of a Lumped Battery Model
Introduction
Aging in batteries occurs due to multiple complex degradation phenomena and side reactions that are occurring simultaneously at different places in the battery. This tutorial demonstrates the Lumped Battery interface for modeling capacity loss in a lithium-ion battery.
A set of lumped parameters are used to describe the capacity loss that occurs due to parasitic reactions in the battery. Using a lumped modeling approach, assuming no knowledge of the internal structure or design of the battery electrodes or choice of materials, any aging model will have to be empirical, not being able to distinguish among different degradation phenomena. Typically, capacity loss and aging may be affected by the battery voltage, capacity throughput, aging history and temperature.
The aging analysis presented in this tutorial includes calendar life and cycle life studies.
Model Definition
The cell model is created using the Lumped Battery interface. The interface requires inputs such as the battery capacity, initial state-of-charge (SOC), an open circuit voltage versus SOC curve, and consists of lumped parameters that represent the ohmic, activation and concentration overpotential contributions. A detailed description on how to optimize the parameters of the lumped model against experimental data can be found in the Application Libraries example Parameter Estimation of a Time-Dependent Lumped Battery Model.
The capacity fade that occurs in the battery due to parasitic reactions is modeled using the Capacity Loss node. The loss kinetics is specified using the in-built expression available in this node. The expression calculates a loss current based on a calendar aging time constant that defines the rate of the parasitic reactions, and dimensionless aging factors dependent on voltage, current, aging history and temperature. The loss current is used to finally calculate the accumulated capacity loss corresponding to the parasitic reactions.
In this tutorial, representative values have been used for the lumped parameters corresponding to the voltage losses and capacity loss. The aging analysis includes calendar life and cycle life studies. The temperature is set to 298.15 K in both studies.
A calendar life analysis involves aging the battery at open circuit at constant SOC. Potentiostatic mode of operation is used for maintaining the battery at a particular SOC. The calendar life aging analysis requires that aging factors dependent on voltage and aging history are included. The aging factor dependent on voltage relates to change in the parasitic reaction rate for different values of the battery voltage or SOC, and would correspond either to a parasitic electrochemical reduction reaction occurring on the negative electrode, or an oxidation reaction occurring on the positive electrode. The rate of capacity fade may be slowed down as a result of products formed by the parasitic reactions, for example by the formation of a mass-transport limiting film on the electrode particles. A decelerating aging rate is defined using the aging factor dependent on aging history. The calendar life aging study sets up a parametric sweep over three different applied battery voltages corresponding to the particular states-of-charge (25%, 50% and 100% SOC). The battery is aged for a period of two years in the calendar life study.
A cycle life analysis of the battery is performed in the second part of the tutorial, where the battery is aged using a constant 1C charge-discharge cycling scheme. Charge-discharge cycling mode of operation is used to set up the 1C cycling scheme, that starts with a 1C discharge till the cell reaches a minimum voltage of 3.2 V, followed by a 500 s rest period, a 1C charge till the cell attains a maximum voltage of 4.15 V, and finally followed by a 500 s rest period. Figure 1 shows the cell potential and current corresponding to the 1C charge-discharge cycling scheme. The corresponding cell state-of-charge variation is shown in Figure 2.
Figure 1: Cell potential and current corresponding to the 1C charge-discharge cycling scheme.
Figure 2: Cell state-of-charge and current corresponding to the 1C charge-discharge cycling scheme.
In the cycle life aging analysis, the aging factor dependent on current is also included, in addition to the aging factors dependent on voltage and aging history. For many battery systems it is often observed that the lifetime is closely related to the amount of cycled equivalent full cycles (capacity throughput) and hence the aging factor dependent on current is used to define the additional capacity loss induced by cycling. The battery is aged for a period of 1 year in the cycle life study.
Note that when computing the studies in the model file available in Application Libraries, ‘Study 1: Calendar life’ requires that the operation mode is set to Potentiostatic at the Lumped Battery interface level and ‘Study 2: Cycle life’ requires that the operation mode is set to Charge-discharge cycling at the Lumped Battery interface level.
Results and Discussion
Figure 3 shows the relative cell capacity variation with time, for the calendar life and cycle life studies.
Figure 3: Relative cell capacity variation with time, for the calendar life and cycle life studies.
In many lithium-ion battery systems, it is seen that high SOC values (typically resulting in high battery voltage) accelerate capacity loss. The same is observed Figure 3, where the capacity loss is seen to be higher for calendar aging at higher SOC values. Additionally, the capacity loss is seen to be accelerated during the 1C cycle life aging.
The behavior seen in Figure 3 is similar to that typically observed for many battery systems. In this tutorial, representative values have been chosen for the lumped parameters describing capacity loss. Alternatively, these parameters can be obtained by parameter estimation (using an optimization solver) against available experimental data for calendar life and cycle life aging. Subsequently, the cell model using the optimized parameters can be used for capacity loss prediction of batteries aged using more complex cycling schemes.
Reference
1. H. Ekström and G. Lindbergh “A model for predicting capacity fade due to SEI formation in a commercial Graphite/LiFePO4 cell,” J. Electrochemical Society, vol. 162, pp. A1003–A1007, 2015.
Application Library path: Battery_Design_Module/Batteries,_Lithium-Ion/lumped_li_battery_capacity_loss
Modeling Instructions
From the File menu, choose New.
New
In the New window, click  Model Wizard.
Model Wizard
1
In the Model Wizard window, click  0D.
2
In the Select Physics tree, select Electrochemistry>Batteries>Lumped Battery (lb).
3
Click Add.
4
Click  Study.
5
In the Select Study tree, select General Studies>Time Dependent.
6
Global Definitions
Parameters 1
Import the model parameters from a text file.
1
In the Model Builder window, under Global Definitions click Parameters 1.
2
In the Settings window for Parameters, locate the Parameters section.
3
Click  Load from File.
4
Lumped Battery (lb)
You will now start defining the battery model. A calendar life analysis of the battery is performed in the first part of the tutorial, where the battery is aged at open circuit at constant state-of-charge. Potentiostatic mode of operation is used for maintaining the battery at a particular state-of-charge.
1
In the Model Builder window, under Component 1 (comp1) click Lumped Battery (lb).
2
In the Settings window for Lumped Battery, locate the Operation Mode section.
3
From the Operation mode list, choose Potentiostatic.
4
In the Eapp text field, type E_app.
5
Locate the Battery Settings section. In the Qcell,0 text field, type Q_cell0.
6
In the SOCcell,0 text field, type SOC_0.
E_app, Q_cell0 and SOC_0 were defined in the parameter text file you imported before.
Cell Equilibrium Potential 1
Load the open circuit voltage data at the reference temperature from a text file. Note that in this model the reference temperature is same as the simulation temperature.
1
In the Model Builder window, under Component 1 (comp1)>Lumped Battery (lb) click Cell Equilibrium Potential 1.
2
In the Settings window for Cell Equilibrium Potential, locate the Open Circuit Voltage section.
3
Click  Clear Table.
Note that it is important to clear the table before loading data from the text file.
4
Click  Load from File.
5
6
In the Tref text field, type T.
Note that in this node you may also add data for the temperature derivative of open circuit voltage, that is used to calculate the temperature dependence of the open circuit voltage. Additionally, this data is used in the calculation of the reversible (entropic) contribution and heat of mixing contribution to the total heat source. However, this data is not needed in this model.
Voltage Losses 1
Specify the lumped parameter values for the voltage losses.
1
In the Model Builder window, click Voltage Losses 1.
2
In the Settings window for Voltage Losses, locate the Model Input section.
3
In the T text field, type T.
4
Locate the Ohmic Overpotential section. In the ηIR,1C text field, type eta_IR_1C.
5
Locate the Activation Overpotential section. In the J0 text field, type J0.
6
Locate the Concentration Overpotential section. Select the Include concentration overpotential check box.
7
In the τ text field, type tau.
Capacity Loss 1
Add a Capacity Loss node to define the accumulated capacity loss in the battery corresponding to parasitic reactions. The loss kinetics is specified using the Built in option that calculates a loss current based on a Calendar aging time constant that defines the rate of the parasitic reactions, and dimensionless aging factors dependent on Voltage, Current, Aging history and Temperature, respectively.
1
In the Physics toolbar, click  Global and choose Capacity Loss.
The calendar life aging study requires that aging factors dependent on Voltage and Aging history are included.
2
In the Settings window for Capacity Loss, locate the Model Input section.
3
In the T text field, type T.
4
Locate the Capacity Loss section. In the τloss text field, type tau_loss.
5
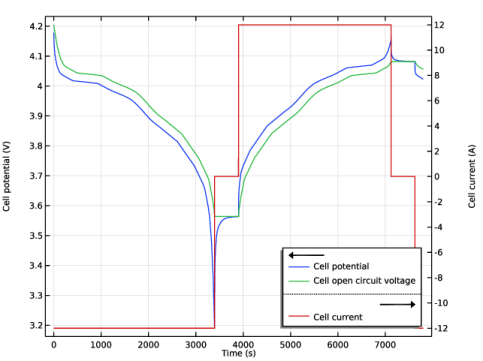
Select the Voltage check box.
6
In the Eoffset text field, type E_offset.
7
In the α text field, type alpha.
8
Select the Aging history check box.
9
In the G text field, type G.
Study 1: Calendar life
The first study performs a calendar life aging analysis of the battery, where the battery is aged at open circuit at constant state-of-charge. Set up a parametric sweep for different applied voltages corresponding to particular states-of-charge. The battery is aged for two years.
1
In the Model Builder window, click Study 1.
2
In the Settings window for Study, type Study 1: Calendar life in the Label text field.
Parametric Sweep
1
In the Study toolbar, click  Parametric Sweep.
2
In the Settings window for Parametric Sweep, locate the Study Settings section.
3
4
5
6
Step 1: Time Dependent
1
In the Model Builder window, click Step 1: Time Dependent.
2
In the Settings window for Time Dependent, locate the Study Settings section.
3
In the Output times text field, type range(0,10[d],2[a]).
4
In the Model Builder window, click Study 1: Calendar life.
5
In the Settings window for Study, locate the Study Settings section.
6
Clear the Generate default plots check box.
7
In the Study toolbar, click  Compute.
Results
Proceed as follows to create a plot (Figure 3) for the relative cell capacity variation with time, at the different state-of-charge values.
Relative Cell Capacity
1
In the Home toolbar, click  Add Plot Group and choose 1D Plot Group.
2
In the Settings window for 1D Plot Group, type Relative Cell Capacity in the Label text field.
3
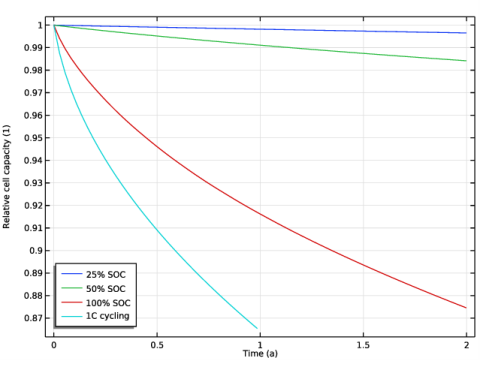
Locate the Data section. From the Dataset list, choose Study 1: Calendar life/Parametric Solutions 1 (sol2).
Global 1
1
Right-click Relative Cell Capacity and choose Global.
2
In the Settings window for Global, locate the y-Axis Data section.
3
4
Locate the x-Axis Data section. From the Unit list, choose a.
5
Click to expand the Legends section. From the Legends list, choose Manual.
6
Relative Cell Capacity
1
In the Model Builder window, click Relative Cell Capacity.
2
In the Settings window for 1D Plot Group, click to expand the Title section.
3
From the Title type list, choose None.
4
Locate the Legend section. From the Position list, choose Lower left.
5
In the Relative Cell Capacity toolbar, click  Plot.
Lumped Battery (lb)
A cycle life aging analysis of the battery is performed in the second part of the tutorial, where the battery is aged using a constant 1C charge-discharge cycling scheme. Charge-discharge cycling mode of operation is used to set up the 1C cycling scheme (refer to Figure 1 and Figure 2). Note that lb.I_1C is the 1C current variable already available in the interface.
1
In the Model Builder window, under Component 1 (comp1) click Lumped Battery (lb).
2
In the Settings window for Lumped Battery, locate the Operation Mode section.
3
From the Operation mode list, choose Charge-discharge cycling.
4
In the Idch text field, type -lb.I_1C.
5
In the Vmin text field, type V_min.
6
Select the Include rest period check box.
7
In the trest,dch text field, type t_rest.
8
In the Ich text field, type lb.I_1C.
9
In the Vmax text field, type V_max.
10
Select the Include rest period check box.
11
In the trest,ch text field, type t_rest.
Capacity Loss 1
The aging factor dependent on Current is also included for the cycle life study.
1
In the Model Builder window, under Component 1 (comp1)>Lumped Battery (lb) click Capacity Loss 1.
2
In the Settings window for Capacity Loss, locate the Capacity Loss section.
3
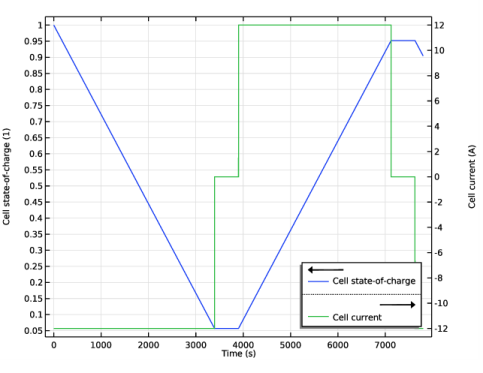
Select the Current check box.
4
In the H text field, type H.
Root
Add a second study to perform a cycle life aging analysis of the battery. The battery is aged for one year.
Add Study
1
In the Home toolbar, click  Add Study to open the Add Study window.
2
Go to the Add Study window.
3
Find the Studies subsection. In the Select Study tree, select General Studies>Time Dependent.
4
Click Add Study in the window toolbar.
5
In the Home toolbar, click  Add Study to close the Add Study window.
Study 2: Cycle life
1
In the Model Builder window, click Study 2.
2
In the Settings window for Study, type Study 2: Cycle life in the Label text field.
Step 1: Time Dependent
1
In the Model Builder window, under Study 2: Cycle life click Step 1: Time Dependent.
2
In the Settings window for Time Dependent, locate the Study Settings section.
3
In the Output times text field, type range(0,10[d],1[a]).
4
In the Model Builder window, click Study 2: Cycle life.
5
In the Settings window for Study, locate the Study Settings section.
6
Clear the Generate default plots check box.
7
In the Home toolbar, click  Compute.
Results
Relative Cell Capacity
Proceed as follows to include the cycle life data in the relative cell capacity plot (Figure 3).
Global 2
1
In the Model Builder window, under Results>Relative Cell Capacity right-click Global 1 and choose Duplicate.
2
In the Settings window for Global, locate the Data section.
3
From the Dataset list, choose Study 2: Cycle life/Solution 6 (sol6).
4
Click to expand the Legends section. In the table, enter the following settings:
Relative Cell Capacity
1
In the Model Builder window, click Relative Cell Capacity.
2
In the Relative Cell Capacity toolbar, click  Plot.