PDF

Diffusion-Induced Stress in a Lithium-Ion Battery
Introduction
Diffusion-induced stress in lithium-ion battery electrode materials can occur as a result of compositional inhomogeneities during lithium intercalation in the host material particles. These stresses are important since the electrode material can undergo significant volume changes during charging and discharging. The accumulated structural changes can induce electrode failure in the form of particle fracture.
In order to quantify the stress generated in the electrode, the elastic deformation of the material must be related to the intercalation process. Since atomic diffusion in solids is a much slower process than elastic deformation, mechanical equilibrium is established much faster than that of diffusion. Hence, mechanical equilibrium can be treated as a static equilibrium problem (Ref. 1 and Ref. 2).
This application models diffusion-induced stress caused by concentration changes within the negative host material electrode particles during discharge and relaxation of a lithium-ion battery. The application uses the Lithium-Ion Battery interface. The radial and tangential components of stress (considering spherical particles in the negative electrode) and von Mises stress inside a particle in the negative electrode are analyzed. It is seen that, during discharge, the von Mises stress is 0 at the center and reaches a maximum value at the surface of the particle. Similarly, the time evolution of radial and tangential components of the diffusion-induced strain at surface of particles along the length of the negative electrode is analyzed during discharge and relaxation. During de-intercalation of lithium ions from the negative electrode particles (discharge), the diffusion-induced surface strain decreases with time. Finally, the behavior and time evolution of the total elastic strain energy density stored in the negative electrode material particles is analyzed. Note that this quantity provides the driving force for particle fracture.
Model Definition
The model is set up for a graphite/LMO battery cell. The materials are available from the Battery Material Library and mainly default settings are selected. The model domains consist of:
Negative porous electrode: Graphite (MCMB LixC6) active material and electronic conductor.
Positive porous electrode: LMO (LiMn2O4) active material, electronic conductor, and filler.
Electrolyte: 1.0 M LiPF6 in EC:DEC (1:1 by weight).
This battery cell assembly gives a cell voltage around 4 V, depending on the state-of-charge (SOC) of the cell.
The model is set up using the Lithium-Ion Battery interface. The interface accounts for the following:
Additionally, the model analyses diffusion-induced stress and strain generated in the negative electrode particles. Assuming the electrode particles to be isotropic linear elastic solids, analytical expressions are calculated at the Particle Intercalation node of the Porous Electrode feature, for several quantities such as stress, hydrostatic stress, von Mises stress, strain, total elastic strain energy density, etc. These expressions require the relative change in volume of the graphite electrode material, which is typically a function of concentration (i.e., state-of-charge) in the particle. For example, graphite material has a volumetric expansion of about 10% over state-of-charge values ranging from 0 to 1. Additionally, the stress and strain expressions require elastic properties such as the Young’s modulus and Poisson’s ratio (note that these elastic properties are assumed to be independent of concentration).
The applied current consists of a discharge current of 4 C that is applied for 850 s, followed by a relaxation period of 250 s.
Results and Discussion
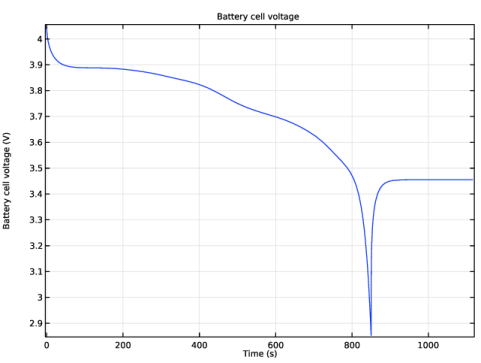
The battery cell voltage profile is plotted as a function of time in Figure 1. Note that a discharge current of 4 C has been applied for 850 s, followed by a relaxation period of 250 s.
Figure 1: Battery cell voltage profile as a function of time.
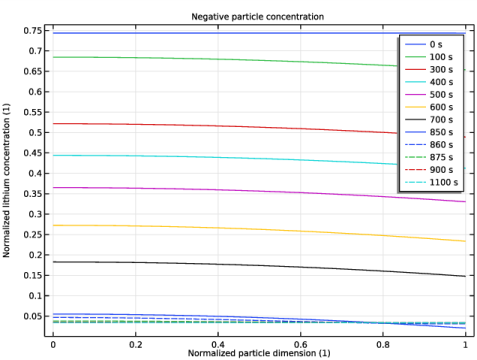
Figure 2 shows the normalized lithium concentration in a particle at a particular position (center) in the negative electrode, at various times during discharge and relaxation. Note in all subsequent plots, the solid and dashed lines refer to the discharge and relaxation periods, respectively. During discharge, which involves de-intercalation of lithium ions from the negative electrode particles, it can be seen that the concentration in the particle decreases with time. At the end of the relaxation period, the concentration settles at a final value.
Figure 2: Normalized lithium concentration in a particle at the center of the negative electrode, at various times during discharge (solid lines) and relaxation (dashed lines).
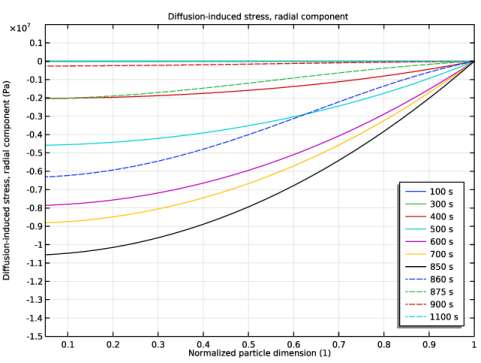
The radial component of the diffusion-induced stress in a particle at the center of the negative electrode, at various times during discharge and relaxation, is shown in Figure 3. During discharge (de-intercalation of lithium ions from the particle), the radial stress is compressive inside the spherical particle. At any given time, the compressive radial stress is highest at the center and decreases monotonically to 0 at the surface of the particle. During the relaxation period, the compressive radial stress inside the particle relaxes to 0.
Figure 3: Radial component of the diffusion-induced stress in a particle at the center of the negative electrode, at various times during discharge (solid lines) and relaxation (dashed lines).
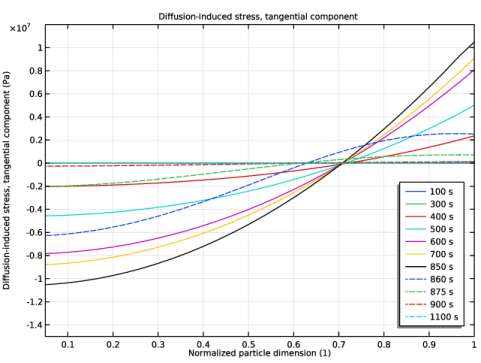
Similarly, Figure 4 shows the tangential component of the diffusion-induced stress in a particle at the center of the negative electrode, at various times during discharge and relaxation. During discharge, the tangential stress is compressive at the center and tensile at the surface of the spherical particle. Note that at the center of the particle, the tangential and radial stresses always have the same magnitude so that the stress state at the center of the particle is purely hydrostatic. The crossover from compressive to tensile occurs at , after the stress reaches steady state.
Figure 4: Tangential component of the diffusion-induced stress in a particle at the center of the negative electrode, at various times during discharge (solid lines) and relaxation (dashed lines).
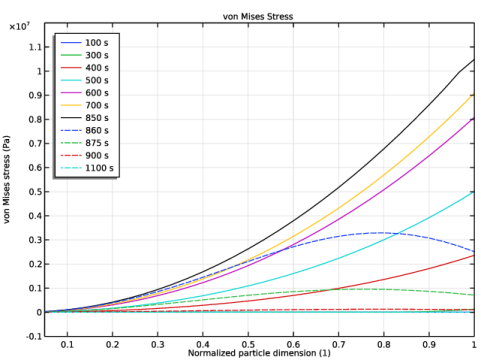
Figure 5 shows the von Mises stress in a particle at the center of the negative electrode, at various times during discharge and relaxation. During discharge, the von Mises stress is 0 at the center of the particle and reaches a maximum value at the surface of the spherical particle. During the relaxation period, the stress inside the particle relaxes to 0.
Figure 5: von Mises stress in a particle at the center of the negative electrode, at various times during discharge (solid lines) and relaxation (dashed lines).
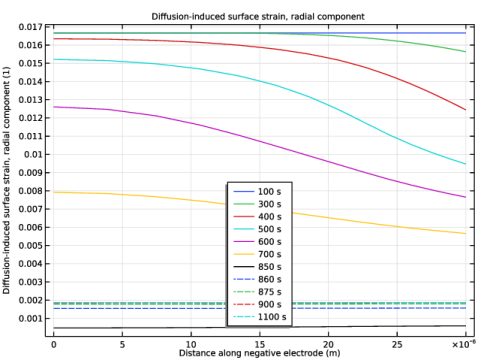
Figure 6 and Figure 7 shows the radial and tangential components, respectively, of the diffusion-induced strain at surface of particles along the length of the negative electrode, at various times during discharge and relaxation. During de-intercalation of lithium ions from the particle, the surface strain decreases with time in the negative electrode. Also, the surface value of strain is not uniform across the electrode because of variation in particle concentration across the electrode. The maximum value of surface strain is observed at the current collector end. At the end of the relaxation period, the strain eventually reaches a value corresponding to the final particle concentration.
Figure 6: Radial component of diffusion-induced surface strain along the length of the negative electrode, at various times during discharge (solid lines) and relaxation (dashed lines).
Figure 7: Tangential component of diffusion-induced surface strain along the length of the negative electrode, at various times during discharge (solid lines) and relaxation (dashed lines).
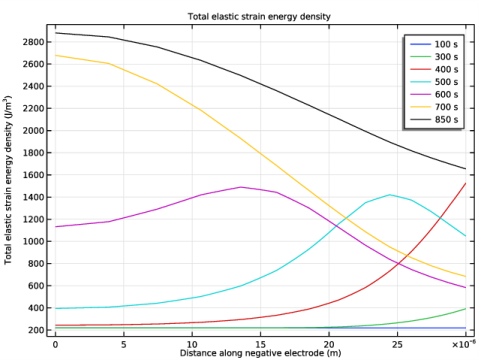
The total elastic strain energy density that is stored in the negative electrode material particles provides the driving force for particle fracture. This quantity is plotted along the length of the negative electrode in Figure 8, at various times during discharge. It can be seen that the total elastic strain energy density increases with time across the electrode. The value is initially higher at the separator end. The maximum value gradually moves across the electrode toward the current collector end at the end of discharge.
Figure 8: Total elastic strain energy density stored in the negative electrode material particles, plotted along the length of the negative electrode, at various times during discharge.
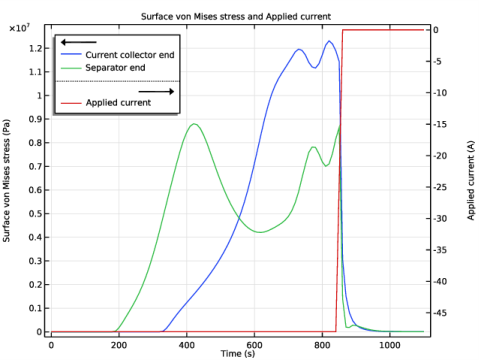
All the above plots show a quantity plotted either across the particle dimension or along the length of the negative electrode, at various times during discharge. Alternatively, it is useful to plot the time evolution of any quantity at different positions in the negative electrode. The von Mises stress at the surface of particles at two positions in the negative electrode (current collector end and separator end) is plotted versus time in Figure 9. The plot also includes the applied current for reference. The von Mises stress contains contribution from both the radial and tangential components of the diffusion-induced stress. As seen from Figure 3 and Figure 4, the surface value of the radial component of the diffusion-induced stress is 0. So, the surface von Mises stress essentially mimics the behavior of the tangential component of the diffusion-induced surface stress. In Figure 9, it can be seen that the von Mises stress initially increases at the separator end and subsequently at the current collector end. The stress induced in the electrode particles varies at different positions along the negative electrode due to concentration gradients in the porous electrode. Similarly, it can be expected that the total elastic strain density, that provides the driving force for fracture, also varies at different positions along the negative electrode. It can be seen in Figure 9 that the surface von Mises stress is higher at the current collector end as compared to the separator end, toward the end of the discharge period. Finally, the stress in the particles relaxes to 0 during the relaxation period.
Figure 9: Time evolution of the von Mises stress at the surface of the particles at two positions in the negative electrode. The applied current is also plotted for reference.
References
1. Y-T. Cheng, and M.W. Verbrugge, “Evolution of stress within a spherical insertion electrode particle under potentiostatic and galvanostatic operation,” Journal of Power Sources, vol. 190, pp. 453–460, 2009.
2. V. Malave, J.R. Berger, and P.A. Martin, “Concentration-dependent chemical expansion in lithium-ion battery cathode particles,” Journal of Applied Mechanics, vol. 81, pp. 091005 1–9, 2014.
Application Library path: Battery_Design_Module/Batteries,_Lithium-Ion/diffusion_induced_stress
Modeling Instructions
Start this tutorial by opening a template file that contains a 1D battery model. Alternatively, you may build the template model yourself by following the instructions found in the template model.
From the File menu, choose Open.
Browse to the model’s Application Libraries folder and double-click the file li_battery_seed.mph.
Global Definitions
Parameters 1
The template model already contains a few parameters. Change the value of the initial cell voltage and add a few parameters for the Young’s modulus and reference exchange current densities.
1
In the Model Builder window, under Global Definitions click Parameters 1.
2
In the Settings window for Parameters, locate the Parameters section.
3
Step 1 (step1)
Define a step function that will be used later to set up the applied current.
1
In the Home toolbar, click  Functions and choose Global>Step.
2
In the Settings window for Step, locate the Parameters section.
3
In the From text field, type 1.
4
In the To text field, type 0.
Relative volume change as function of soc
Define an interpolation function that defines the relative expansion of graphite material as a function of state-of-charge.
1
In the Home toolbar, click  Functions and choose Global>Interpolation.
2
In the Settings window for Interpolation, type Relative volume change as function of soc in the Label text field.
3
Locate the Definition section. In the table, enter the following settings:
4
In the Function name text field, type fvol.
5
Locate the Interpolation and Extrapolation section. From the Interpolation list, choose Piecewise cubic.
6
Locate the Units section. In the Arguments text field, type 1.
7
In the Function text field, type 1.
Definitions (comp1)
Load the variables for this model from a text file.
Variables 1
1
In the Home toolbar, click  Variables and choose Local Variables.
2
In the Settings window for Variables, locate the Variables section.
3
Click  Load from File.
4
Lithium-Ion Battery (liion)
The physics has already been set up in the template model. Next, set up the inputs required for stress and strain calculations in the Particle Intercalation node of the porous electrode domain corresponding to the negative electrode (graphite material). Also, specify the reference exchange current density for the electrode kinetics in the Porous Electrode Reaction nodes of the negative and positive electrodes. Finally, specify the applied current (that corresponds to a discharge current of 4C for 850 s followed by a relaxation period for the next 250 s) in the Electrode Current node.
Particle Intercalation 1
1
In the Model Builder window, expand the Porous Electrode 1 node, then click Particle Intercalation 1.
2
In the Settings window for Particle Intercalation, click to expand the Stress and Strain section.
3
Select the Calculate stress and strain check box.
4
In the E text field, type E.
5
In the ΔV/V0 text field, type fvol(liion.cs_pce1/liion.csmax).
It is essential to have a finer resolution along the graphite particle dimension and this can be done by setting a linear distribution with 30 elements.
6
Click to expand the Particle Discretization section. From the Distribution list, choose Linear.
7
In the Nel text field, type 30.
Porous Electrode Reaction 1
1
In the Model Builder window, click Porous Electrode Reaction 1.
2
In the Settings window for Porous Electrode Reaction, locate the Electrode Kinetics section.
3
In the i0,ref(T) text field, type i0ref_neg.
Porous Electrode Reaction 1
1
In the Model Builder window, expand the Porous Electrode 2 node, then click Porous Electrode Reaction 1.
2
In the Settings window for Porous Electrode Reaction, locate the Electrode Kinetics section.
3
In the i0,ref(T) text field, type i0ref_pos.
Electrode Current 1
1
In the Model Builder window, click Electrode Current 1.
2
In the Settings window for Electrode Current, locate the Electrode Current section.
3
In the Is,total text field, type Iapp.
Study 1
Step 2: Time Dependent
1
In the Model Builder window, expand the Study 1 node, then click Step 2: Time Dependent.
2
In the Settings window for Time Dependent, locate the Study Settings section.
3
In the Output times text field, type range(0,10,1100).
4
In the Model Builder window, click Study 1.
5
In the Settings window for Study, locate the Study Settings section.
6
Clear the Generate default plots check box.
7
In the Home toolbar, click  Compute.
Results
Battery cell voltage
The probe plot show the battery cell voltage (Figure 1).
1
In the Model Builder window, under Results click Probe Plot Group 1.
2
In the Settings window for 1D Plot Group, type Battery cell voltage in the Label text field.
3
Click to expand the Title section. From the Title type list, choose Label.
4
Locate the Plot Settings section. Select the y-axis label check box.
5
In the associated text field, type Battery cell voltage (V).
6
Locate the Legend section. Clear the Show legends check box.
7
In the Battery cell voltage toolbar, click  Plot.
Study 1/Solution 1 (sol1)
To plot along the graphite particle dimension, you need to create a Solution dataset that refers to the extra dimension that is set up by the Porous Electrode node corresponding to the negative electrode.
Study 1/Solution 1 (4) (sol1)
1
In the Model Builder window, expand the Results>Datasets node.
2
Right-click Results>Datasets>Study 1/Solution 1 (sol1) and choose Duplicate.
3
In the Settings window for Solution, locate the Solution section.
4
From the Component list, choose Extra Dimension from Particle Intercalation 1 (liion_pce1_pin1_xdim).
Negative particle concentration
Next, follow the steps below to plot the normalized lithium concentration in a particle at a particular position (say center) in the negative electrode, at various times during discharge and relaxation. Note in all the subsequent plots in the model, the solid and dashed lines refer to the discharge period and the relaxation period, respectively. (Figure 2).
1
In the Home toolbar, click  Add Plot Group and choose 1D Plot Group.
2
In the Settings window for 1D Plot Group, type Negative particle concentration in the Label text field.
Line Graph 1
1
Right-click Negative particle concentration and choose Line Graph.
2
In the Settings window for Line Graph, locate the Data section.
3
From the Dataset list, choose Study 1/Solution 1 (4) (sol1).
4
From the Time selection list, choose Interpolated.
5
In the Times (s) text field, type 0,100,300,400,500,600,700,850.
6
Locate the Selection section. From the Selection list, choose All domains.
7
Locate the y-Axis Data section. In the Expression text field, type comp1.atxd1(15e-6,liion.cs_pce1/liion.csmax).
8
Click to expand the Legends section. Select the Show legends check box.
Line Graph 2
1
Right-click Line Graph 1 and choose Duplicate.
2
In the Settings window for Line Graph, locate the Data section.
3
In the Times (s) text field, type 860,875,900,1100.
4
Click to expand the Coloring and Style section. Find the Line style subsection. From the Line list, choose Dashed.
5
From the Color list, choose Cycle (reset).
Negative particle concentration
1
In the Model Builder window, click Negative particle concentration.
2
In the Settings window for 1D Plot Group, locate the Title section.
3
From the Title type list, choose Label.
4
Locate the Plot Settings section. Select the x-axis label check box.
5
In the associated text field, type Normalized particle dimension (1).
6
Select the y-axis label check box.
7
In the associated text field, type Normalized lithium concentration (1).
8
In the Negative particle concentration toolbar, click  Plot.
Now, create a plot of the radial component of the diffusion-induced stress in a particle (Figure 3) at the center of the negative electrode, at various times during discharge and relaxation. This can be done by duplicating the previous plot.
Diffusion-induced stress, radial component
1
Right-click Negative particle concentration and choose Duplicate.
2
In the Settings window for 1D Plot Group, type Diffusion-induced stress, radial component in the Label text field.
3
Locate the Plot Settings section. In the y-axis label text field, type Diffusion-induced stress, radial component (Pa).
Line Graph 1
1
In the Model Builder window, expand the Diffusion-induced stress, radial component node, then click Line Graph 1.
2
In the Settings window for Line Graph, locate the Data section.
3
In the Times (s) text field, type 100,300,400,500,600,700,850.
4
Locate the y-Axis Data section. In the Expression text field, type comp1.atxd1(15e-6,liion.sr_pce1).
5
Click to expand the Quality section. From the Resolution list, choose No refinement.
Line Graph 2
1
In the Model Builder window, click Line Graph 2.
2
In the Settings window for Line Graph, locate the y-Axis Data section.
3
In the Expression text field, type comp1.atxd1(15e-6,liion.sr_pce1).
4
Locate the Quality section. From the Resolution list, choose No refinement.
Diffusion-induced stress, radial component
1
In the Model Builder window, click Diffusion-induced stress, radial component.
2
In the Settings window for 1D Plot Group, locate the Axis section.
3
Select the Manual axis limits check box.
4
In the x minimum text field, type 0.05.
5
In the x maximum text field, type 1.
6
In the y minimum text field, type -1.5E7.
7
In the y maximum text field, type 0.2E7.
8
Locate the Legend section. From the Position list, choose Lower right.
9
In the Diffusion-induced stress, radial component toolbar, click  Plot.
Now, create a plot of the tangential component of the diffusion-induced stress in a particle (Figure 4) at the center of the negative electrode, at various times during discharge and relaxation. This can be done by duplicating the previous plot.
Diffusion-induced stress, tangential component
1
Right-click Diffusion-induced stress, radial component and choose Duplicate.
2
In the Settings window for 1D Plot Group, type Diffusion-induced stress, tangential component in the Label text field.
3
Locate the Plot Settings section. In the y-axis label text field, type Diffusion-induced stress, tangential component (Pa).
Line Graph 1
1
In the Model Builder window, expand the Diffusion-induced stress, tangential component node, then click Line Graph 1.
2
In the Settings window for Line Graph, locate the y-Axis Data section.
3
In the Expression text field, type comp1.atxd1(15e-6,liion.stheta_pce1).
Line Graph 2
1
In the Model Builder window, click Line Graph 2.
2
In the Settings window for Line Graph, locate the y-Axis Data section.
3
In the Expression text field, type comp1.atxd1(15e-6,liion.stheta_pce1).
Diffusion-induced stress, tangential component
1
In the Model Builder window, click Diffusion-induced stress, tangential component.
2
In the Settings window for 1D Plot Group, locate the Axis section.
3
In the y maximum text field, type 1.2E7.
4
In the Diffusion-induced stress, tangential component toolbar, click  Plot.
Now, create a plot of the von Mises stress in a particle (Figure 5) at the center of the negative electrode, at various times during discharge and relaxation. This can be done by duplicating the previous plot.
von Mises Stress
1
Right-click Diffusion-induced stress, tangential component and choose Duplicate.
2
In the Settings window for 1D Plot Group, type von Mises Stress in the Label text field.
3
Locate the Plot Settings section. In the y-axis label text field, type von Mises stress (Pa).
Line Graph 1
1
In the Model Builder window, expand the von Mises Stress node, then click Line Graph 1.
2
In the Settings window for Line Graph, locate the y-Axis Data section.
3
In the Expression text field, type comp1.atxd1(15e-6,liion.mises_pce1).
Line Graph 2
1
In the Model Builder window, click Line Graph 2.
2
In the Settings window for Line Graph, locate the y-Axis Data section.
3
In the Expression text field, type comp1.atxd1(15e-6,liion.mises_pce1).
von Mises Stress
1
In the Model Builder window, click von Mises Stress.
2
In the Settings window for 1D Plot Group, locate the Axis section.
3
In the y minimum text field, type -0.1E7.
4
Locate the Legend section. From the Position list, choose Upper left.
5
In the von Mises Stress toolbar, click  Plot.
Next, create a plot of the radial component of the diffusion-induced surface strain (Figure 6) along the length of the negative electrode.
Diffusion-induced surface strain, radial component
1
In the Home toolbar, click  Add Plot Group and choose 1D Plot Group.
2
In the Settings window for 1D Plot Group, type Diffusion-induced surface strain, radial component in the Label text field.
Line Graph 1
1
Right-click Diffusion-induced surface strain, radial component and choose Line Graph.
2
In the Settings window for Line Graph, locate the Data section.
3
From the Dataset list, choose Study 1/Solution 1 (1) (sol1).
4
From the Time selection list, choose Interpolated.
5
In the Times (s) text field, type 100,300,400,500,600,700,850.
6
7
Click Replace Expression in the upper-right corner of the y-Axis Data section. From the menu, choose Component 1 (comp1)>Lithium-Ion Battery>Stress and strain>liion.er_surface_pce1 - Diffusion-induced surface strain, radial component.
8
Locate the Legends section. Select the Show legends check box.
Line Graph 2
1
Right-click Line Graph 1 and choose Duplicate.
2
In the Settings window for Line Graph, locate the Data section.
3
In the Times (s) text field, type 860,875,900,1100.
4
Locate the Coloring and Style section. Find the Line style subsection. From the Line list, choose Dashed.
5
From the Color list, choose Cycle (reset).
Diffusion-induced surface strain, radial component
1
In the Model Builder window, click Diffusion-induced surface strain, radial component.
2
In the Settings window for 1D Plot Group, locate the Title section.
3
From the Title type list, choose Manual.
4
In the Title text area, type Diffusion-induced surface strain, radial component.
5
Locate the Plot Settings section. Select the x-axis label check box.
6
In the associated text field, type Distance along negative electrode (m).
7
Locate the Legend section. From the Position list, choose Lower middle.
8
In the Diffusion-induced surface strain, radial component toolbar, click  Plot.
Next, create a plot of the tangential component of the diffusion-induced surface strain (Figure 7) along the length of the negative electrode. This can be done by duplicating the previous plot.
Diffusion-induced surface strain, tangential component
1
Right-click Diffusion-induced surface strain, radial component and choose Duplicate.
2
In the Settings window for 1D Plot Group, type Diffusion-induced surface strain, tangential component in the Label text field.
3
Locate the Title section. In the Title text area, type Diffusion-induced surface strain, tangential component.
Line Graph 1
1
In the Model Builder window, expand the Diffusion-induced surface strain, tangential component node, then click Line Graph 1.
2
In the Settings window for Line Graph, click Replace Expression in the upper-right corner of the y-Axis Data section. From the menu, choose Component 1 (comp1)>Lithium-Ion Battery>Stress and strain>liion.etheta_surface_pce1 - Diffusion-induced surface strain, tangential component.
Line Graph 2
1
In the Model Builder window, click Line Graph 2.
2
In the Settings window for Line Graph, click Replace Expression in the upper-right corner of the y-Axis Data section. From the menu, choose Component 1 (comp1)>Lithium-Ion Battery>Stress and strain>liion.etheta_surface_pce1 - Diffusion-induced surface strain, tangential component.
Diffusion-induced surface strain, tangential component
1
In the Model Builder window, click Diffusion-induced surface strain, tangential component.
2
In the Diffusion-induced surface strain, tangential component toolbar, click  Plot.
Total elastic strain energy density
Next, create a plot of the total elastic strain energy density stored in the negative electrode material particles (Figure 8) along the length of the negative electrode.
1
In the Home toolbar, click  Add Plot Group and choose 1D Plot Group.
2
In the Settings window for 1D Plot Group, type Total elastic strain energy density in the Label text field.
Line Graph 1
1
Right-click Total elastic strain energy density and choose Line Graph.
2
In the Settings window for Line Graph, locate the Data section.
3
From the Dataset list, choose Study 1/Solution 1 (1) (sol1).
4
From the Time selection list, choose Interpolated.
5
In the Times (s) text field, type 100,300,400,500,600,700,850.
6
7
Click Replace Expression in the upper-right corner of the y-Axis Data section. From the menu, choose Component 1 (comp1)>Lithium-Ion Battery>Stress and strain>liion.Ws_tot_pce1 - Total elastic strain energy density - J/m³.
8
Locate the Legends section. Select the Show legends check box.
Total elastic strain energy density
1
In the Model Builder window, click Total elastic strain energy density.
2
In the Settings window for 1D Plot Group, locate the Title section.
3
From the Title type list, choose Label.
4
Locate the Plot Settings section. Select the x-axis label check box.
5
In the associated text field, type Distance along negative electrode (m).
6
In the Total elastic strain energy density toolbar, click  Plot.
Surface von Mises stress versus time
Finally, create a plot that shows the time evolution of the von Mises stress at the surface of the particles (Figure 9) at two positions in the negative electrode (current collector end and separator end). Also include the applied current on the same plot for reference.
1
In the Home toolbar, click  Add Plot Group and choose 1D Plot Group.
2
In the Settings window for 1D Plot Group, type Surface von Mises stress versus time in the Label text field.
Point Graph 1
1
Right-click Surface von Mises stress versus time and choose Point Graph.
2
3
In the Settings window for Point Graph, click Replace Expression in the upper-right corner of the y-Axis Data section. From the menu, choose Component 1 (comp1)>Lithium-Ion Battery>Stress and strain>liion.mises_surface_pce1 - Surface von Mises stress - Pa.
4
Click to expand the Legends section. Select the Show legends check box.
5
From the Legends list, choose Manual.
6
Global 1
1
In the Model Builder window, right-click Surface von Mises stress versus time and choose Global.
2
In the Settings window for Global, click Replace Expression in the upper-right corner of the y-Axis Data section. From the menu, choose Component 1 (comp1)>Definitions>Variables>Iapp - Applied current - A.
Surface von Mises stress versus time
1
In the Model Builder window, click Surface von Mises stress versus time.
2
In the Settings window for 1D Plot Group, locate the Plot Settings section.
3
Select the Two y-axes check box.
4
In the table, select the Plot on secondary y-axis check box for Global 1.
5
Locate the Title section. From the Title type list, choose Manual.
6
In the Title text area, type Surface von Mises stress and Applied current.
7
Locate the Legend section. From the Position list, choose Upper left.
8
In the Surface von Mises stress versus time toolbar, click  Plot.