PDF

Eigenmodes in a Muffler
Introduction
In this example, you compute the propagating modes in the chamber of an automotive muffler. The geometry is a cross section of the chamber in the Absorptive Muffler example.
The purpose of the model is to study the shape of the propagating modes and to find their cut-off frequencies. As discussed in the documentation of the Absorptive Muffler example, some of the modes significantly affect the damping of the muffler at frequencies above their cut-off. In this model, you study modes with cut-off frequencies up to 1500 Hz.
Model Definition
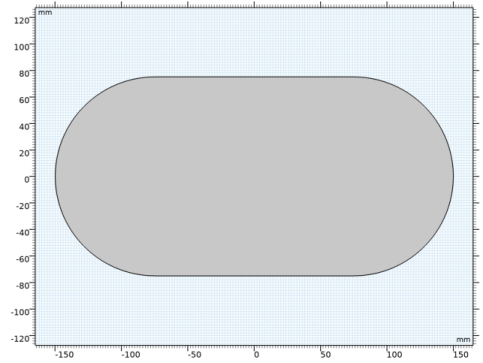
The muffler chamber has a race track shaped cross section, as seen in Figure 1. In this model, the chamber is considered to be hollow and field with air at atmospheric pressure.
Figure 1: The model geometry.
The wave numbers and mode shapes through a cross section of the chamber are found as the solution of an eigenvalue problem for the acoustic pressure p:
where ρ0 is the density, c the speed of sound, κz the out-of-plane wave number, and ω = 2π f the angular frequency. For a given angular frequency, only modes such that κz2 is positive can propagate. The cutoff frequency of each mode is calculated as
Results and Discussion
The model finds five propagating modes, whose characteristics are summed up in the table here below.
For a muffler with a centered tube leading into the chamber, the first mode that is symmetric with respect to both the  x-axis and the y-axis is propagating when the frequency is higher than 1240 Hz. Figure 2 shows this mode, which for an infinitely long chamber occurs at 1240 Hz.
Figure 2: The chamber’s first fully symmetric propagation mode. The plot shows the absolute value of the pressure.
Application Library path: Acoustics_Module/Automotive/eigenmodes_in_muffler
Modeling Instructions
From the File menu, choose New.
New
In the New window, click  Model Wizard.
Model Wizard
1
In the Model Wizard window, click  2D.
2
In the Select Physics tree, select Acoustics>Pressure Acoustics>Pressure Acoustics, Frequency Domain (acpr).
3
Click Add.
4
Click  Study.
5
In the Select Study tree, select Preset Studies for Selected Physics Interfaces>Mode Analysis.
6
Geometry 1
1
In the Model Builder window, under Component 1 (comp1) click Geometry 1.
2
In the Settings window for Geometry, locate the Units section.
3
From the Length unit list, choose mm.
Square 1 (sq1)
1
In the Geometry toolbar, click  Square.
2
In the Settings window for Square, locate the Size section.
3
In the Side length text field, type 150.
4
Locate the Position section. From the Base list, choose Center.
Circle 1 (c1)
1
In the Geometry toolbar, click  Circle.
2
In the Settings window for Circle, locate the Size and Shape section.
3
In the Radius text field, type 75.
4
Locate the Position section. In the x text field, type -75.
Circle 2 (c2)
1
In the Geometry toolbar, click  Circle.
2
In the Settings window for Circle, locate the Size and Shape section.
3
In the Radius text field, type 75.
4
Locate the Position section. In the x text field, type 75.
Union 1 (uni1)
1
In the Geometry toolbar, click  Booleans and Partitions and choose Union.
2
Click in the Graphics window and then press Ctrl+A to select all objects.
3
In the Settings window for Union, locate the Union section.
4
Clear the Keep interior boundaries check box.
5
Click  Build All Objects.
6
Click the  Zoom Extents button in the Graphics toolbar.
Add Material
1
In the Home toolbar, click  Add Material to open the Add Material window.
2
Go to the Add Material window.
3
4
Click Add to Component in the window toolbar.
5
In the Home toolbar, click  Add Material to close the Add Material window.
By default, the boundaries of the geometry will be considered to be sound hard walls. No other physics settings are needed.
Mesh 1
The default mesh gives sufficiently accurate results for this analysis. You can therefore skip all mesh settings and proceed to the solver settings.
Study 1
Step 1: Mode Analysis
1
In the Model Builder window, under Study 1 click Step 1: Mode Analysis.
2
In the Settings window for Mode Analysis, locate the Study Settings section.
3
Select the Desired number of modes check box.
4
5
Select the Search for modes around check box.
6
The free-space propagation mode has an out-of-plane wave number equal to omega/c = 27.5 rad/m. With these settings, the solver returns the 8 modes with propagation constants closest to 20 rad/m first in the list.
7
In the Mode analysis frequency text field, type 1500[Hz].
This setting makes the software look for propagating modes with cutoff frequencies up to 1500 Hz.
8
In the Home toolbar, click  Compute.
Results
Absolute Acoustic Pressure (acpr)
1
In the Settings window for 2D Plot Group, type Absolute Acoustic Pressure (acpr) in the Label text field.
The solver has found the free-space mode and all other propagating modes. There is a total of 5 different propagating modes. Because the waves can propagate both into and out of the modeling plane, each mode gets reported twice, with positive and negative out-of-plane wave numbers.
For the positive out-of-plane wave numbers, it holds that the higher the mode, the lower the wave number. However, the solver does not stop at zero. Because you asked for more than the 5 existing propagating modes, you get additional modes with imaginary out-of-plane wave numbers. This indicates that they are evanescent. The default plot shows the acoustic pressure distribution for a mode with a wave number of -17.95i rad/m.
2
Locate the Data section. From the Out-of-plane wave number list, choose 15.461.
3
In the Absolute Acoustic Pressure (acpr) toolbar, click  Plot.
4
Click the  Zoom Extents button in the Graphics toolbar.
This is the lowest fully symmetric mode. In order to reproduce Figure 2, plot the absolute value of the pressure.
Surface 1
1
In the Model Builder window, expand the Absolute Acoustic Pressure (acpr) node, then click Surface 1.
2
In the Settings window for Surface, click Replace Expression in the upper-right corner of the Expression section. From the menu, choose Component 1 (comp1)>Pressure Acoustics, Frequency Domain>Pressure and sound pressure level>acpr.absp_t - Absolute total acoustic pressure - Pa.
3
Locate the Coloring and Style section. From the Color table list, choose Rainbow.
4
Clear the Symmetrize color range check box.
5
In the Absolute Acoustic Pressure (acpr) toolbar, click  Plot.
6
Click the  Zoom Extents button in the Graphics toolbar.
You can compute the cut-off frequency of this mode using the expression in the model introduction. In order to refer to the speed of sound in air, use an arbitrary point in the geometry for this evaluation.
Point Evaluation 1
1
In the Results toolbar, click  Point Evaluation.
2
In the Settings window for Point Evaluation, locate the Data section.
3
From the Out-of-plane wave number selection list, choose From list.
4
In the Out-of-plane wave number list, select 15.461.
5
6
Locate the Expressions section. In the table, enter the following settings:
7
Click  Evaluate.