PDF

Quadrupole Mass Filter
Introduction
A quadrupole mass filter (QMF) is a key component of a modern mass spectrometer. A QMF uses direct current (DC) and alternating current (AC) electric fields to analyze positive or negative ions by mass-to-charge ratio. A QMF consists of four parallel rods spaced equidistantly. The ratio of the rod radius to the radius of the inscribed circle is 1.148 (Ref. 1). Opposite pairs of rods are electrically connected. Adjacent rods have opposite DC potentials and their AC potentials are out of phase. Typical rod diameters are between 5 and 12 mm with rod lengths between 100 and 200 mm. The frequency of the AC component of the electric field is typically in the range 1 to 10 MHz.
Ions are created using a number of different techniques depending on the application. They are injected along the axis of the QMF. Typical ion energies at the QMF entrance aperture are 3 to 5 electron volts. The ions experience forces due to the AC and DC fields near the quadrupole axis. For certain AC and DC field values only an ion of a specific mass to charge ratio is transmitted. Ions are detected by measuring the ion current at the exit of the quadrupole.
Note: This application requires the Particle Tracing Module.
Model Definition
The cross section of a typical QMF is shown in Figure 1. The ions are injected in such a way that their initial velocity is directed only in the out-of-plane direction. As long as the ions remain in the QMF they experience forces in the x and y direction due to the DC and AC fields. The rod radius is 2.78 mm and the radius of the inscribed circle is about 2.42 mm. Since this is a 2D model, there is no rod length. However, since the ion velocity is assumed constant in the out-of-plane direction, the effective rod length can be computed by multiplying the out-of-plane ion velocity by the total simulation time. The total simulation time is 40 μs, which, for an RF frequency of 4 MHz, corresponds to 160 RF cycles. For an initial ion energy of 3 eV and an ion mass of 40 amu, this corresponds to an effective rod length of 152 mm.
Figure 1: Plot of the model geometry. The geometry length unit is meters.
This application is designed to find the transmission probability of ions in the QMF for different values of two dimensionless parameters, a and q. These are coefficients in the Mathieu equation, which can be used to solve the same problem as this application. However, this application can be generalized to 3D and the effects of fringing fields may also be included. The parameters a and q are scaled values for the DC and AC voltages respectively. It is important to note that in order to gain an accurate statistical measure of the transmission probability, it may be necessary to solve for a much larger number of particles (Ref. 1). The parameter, a, is related to the applied DC voltage by:
where
Z (dimensionless) is the charge number,
e = 1.602176565 × 10-19 C is the elementary charge,
Udc (SI unit: V) is the applied DC voltage,
m (SI unit: kg) is the particle mass,
r0 (SI unit: m) is the inscribed radius, and
ω (SI unit: Hz) is the angular frequency.
The parameter q is related to the applied AC voltage by:
By solving the Mathieu equation it is possible to construct a stability diagram that shows whether the particles undergo stable or unstable oscillatory motion down the QMF. The stability diagram is plotted in Figure 2.
Figure 2: Stability diagram for a quadrupole mass filter.
So long as the values of a and q (and thus Udc and Vac) remain within the gray region, the particles do not make contact with the rods. The operating principle of a QMF is to sweep through a range of values for q whilst keeping the ratio of a/q constant. The idea is illustrated in Figure 3. The values of a and q are both increased simultaneously such that they follow the red line. The ion trajectories are initially unstable, which results in a transmission probability of zero. Once the value of q reaches about 0.6, the ions enter the stable operating region and some particles are transmitted to the detector. As the value of q increases further, the ions end up back in the unstable region and the transmission probability is reduced to zero.
Figure 3: Operating principle of a quadrupole mass filter.
For the DC field, the application solves Poisson’s equation for the electric potential, U:
(1)
Here ε0 is the permittivity of free space (SI unit: F/m) and εr is the relative permittivity of the medium (taken as 1 in this application). The zero on the right-hand side of Equation 1 indicates that the space charge density inside the quadrupole is negligible. On the north and south rods, a positive potential of magnitude Udc is applied:
and on the east and west rods, a negative potential is applied:
For the AC fields, the conservation of electric currents is used to compute the AC potential, V:
where σ is the electrical conductivity in the filter (taken as zero here) and ω is the angular frequency (SI unit: Hz).
On the north and south rods, a positive potential of magnitude Vac is applied:
and on the east and west rods, a negative potential is applied:
In order to construct the total electric field which the particles experience once they enter the modeling domain, superposition of the AC and DC fields is used. This is a valid assumption in this case since the equations solved for the AC and DC fields are linear.
Particle motion is governed by Newton’s second law:
where m is the particle mass (SI unit: kg), v is the particle velocity (SI unit: m/s), Z is the dimensionless charge number, e is the elementary charge (SI unit: s A), and E is the electric field (SI unit: V/m). The electric field contains two contributions, a stationary electric field and one which is changing over time:
where:
and
where the tilde denotes that the AC electric potential is complex-valued. The particle position, q, is simply computed from the definition of the velocity:
The particles have no initial velocity in the modeling plane. Particles are not only released at the simulation start time, they must be released at uniformly spaced times over the first RF cycle of the AC field. Particles are released at 11 times from 0 s to 0.25 μs; since the frequency of the AC field is 4 MHz, this corresponds to one full RF cycle.
Results and Discussion
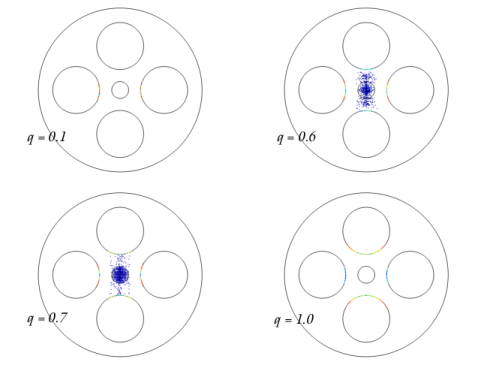
The location of the ions for different values of the parameter q after 140 RF cycles are plotted in Figure 4. As expected, all the injected ions make contact with the rods up to a value of 0.6. For 0.7, however, there are ions that have clearly not made contact with the rods. These ions are detected by a current collector at the end of the QMF.
Figure 4: Plot of the ion location after 140 RF cycles inside the QMF.
The transmission probability is plotted in Figure 5. There is a clear stable window of operation between the values 0.6 and 0.75. This result agrees well with the theory outlined in the Model Definition section. In this example the slope of a/q was fixed to be 0.2/0.7, meaning the width of the transmission peak spans over a q range of 0.15. If the slope of a/q were to be increased, the width of the peak where stable operation occurs would be reduced. If the slope of the curve is greater than 0.237/0.706 then there are no regions of stable operation for any value of q.
As the slope of a/q decreases, the range of q values for which the ion trajectories are stable increases.
Figure 5: Plot of the transmission probability through the QMF for different values of q.
Notes About the COMSOL Implementation
Use the Parametric Sweep feature on the parameter q while keeping the ratio a/q constant. For each value of q, separate study steps are called to solve for the fields and particle trajectories.
Reference
1. J.R. Gibson, S. Taylor, and J.H. Leck, “Detailed simulation of mass spectra for quadrupole mass spectrometer systems,” J. Vac. Sci. Technol. A, vol. 18, no. 1, p. 237, 2000.
Application Library path: ACDC_Module/Particle_Tracing/quadrupole_mass_filter
Modeling Instructions
From the File menu, choose New.
New
In the New window, click  Model Wizard.
Model Wizard
1
In the Model Wizard window, click  2D.
2
In the Select Physics tree, select AC/DC>Electric Fields and Currents>Electrostatics (es).
3
Click Add.
4
In the Select Physics tree, select AC/DC>Electric Fields and Currents>Electric Currents (ec).
5
Click Add.
6
In the Select Physics tree, select AC/DC>Particle Tracing>Charged Particle Tracing (cpt).
7
Click Add.
8
Global Definitions
Add some parameters for the quadrupole geometry and physics settings. To save time, the parameters can be loaded from a file. The optimum inscribed radius is the rod radius divided by 1.147.
Parameters 1
1
In the Model Builder window, under Global Definitions click Parameters 1.
2
In the Settings window for Parameters, locate the Parameters section.
3
Click  Load from File.
4
The parameter q will be varied during a Parametric Sweep but the ratio of the DC and AC applied voltages will stay the same. The ionic mass is that of argon.
Geometry 1
Circle 1 (c1)
1
In the Geometry toolbar, click  Circle.
2
In the Settings window for Circle, locate the Size and Shape section.
3
In the Radius text field, type rcase.
Circle 2 (c2)
1
In the Geometry toolbar, click  Circle.
2
In the Settings window for Circle, locate the Size and Shape section.
3
In the Radius text field, type re.
4
Locate the Position section. In the x text field, type re+r0.
Circle 3 (c3)
1
In the Geometry toolbar, click  Circle.
2
In the Settings window for Circle, locate the Size and Shape section.
3
In the Radius text field, type re.
4
Locate the Position section. In the y text field, type re+r0.
Circle 4 (c4)
1
In the Geometry toolbar, click  Circle.
2
In the Settings window for Circle, locate the Size and Shape section.
3
In the Radius text field, type re.
4
Locate the Position section. In the x text field, type -(re+r0).
Circle 5 (c5)
1
In the Geometry toolbar, click  Circle.
2
In the Settings window for Circle, locate the Size and Shape section.
3
In the Radius text field, type re.
4
Locate the Position section. In the y text field, type -(re+r0).
Circle 6 (c6)
1
In the Geometry toolbar, click  Circle.
2
In the Settings window for Circle, locate the Size and Shape section.
3
In the Radius text field, type rsrc.
Difference 1 (dif1)
1
In the Geometry toolbar, click  Booleans and Partitions and choose Difference.
2
3
In the Settings window for Difference, locate the Difference section.
4
Find the Objects to subtract subsection. Select the  Activate Selection toggle button.
5
Select the objects c2, c3, c4, and c5 only.
6
Click  Build All Objects. The geometry should look like Figure 1.
Materials
The ion trap is at near vacuum conditions. The relative permittivity is hence 1 and the conductivity 0.
Material 1 (mat1)
1
In the Model Builder window, under Component 1 (comp1) right-click Materials and choose Blank Material.
2
In the Settings window for Material, locate the Material Contents section.
3
Definitions
It is convenient to define some selections for the positive and negative electrodes.
Positive
1
In the Definitions toolbar, click  Explicit.
2
In the Settings window for Explicit, type Positive in the Label text field.
3
Locate the Input Entities section. From the Geometric entity level list, choose Boundary.
4
Negative
1
In the Definitions toolbar, click  Explicit.
2
In the Settings window for Explicit, type Negative in the Label text field.
3
Locate the Input Entities section. From the Geometric entity level list, choose Boundary.
4
Set the Equation form to Stationary so that the correct equation contribution is generated. This is necessary because the Frequency Domain study step will be used to compute both the AC and DC fields later on.
Electrostatics (es)
1
In the Model Builder window, under Component 1 (comp1) click Electrostatics (es).
2
In the Settings window for Electrostatics, click to expand the Equation section.
3
From the Equation form list, choose Stationary.
Change the name of the dependent variable for the DC field to U.
4
Click to expand the Dependent Variables section. In the Electric potential text field, type U.
Now define the boundary conditions for the DC field.
Electric Potential 1
1
In the Physics toolbar, click  Boundaries and choose Electric Potential.
2
In the Settings window for Electric Potential, locate the Boundary Selection section.
3
From the Selection list, choose Positive.
4
Locate the Electric Potential section. In the V0 text field, type Udc.
Electric Potential 2
1
In the Physics toolbar, click  Boundaries and choose Electric Potential.
2
In the Settings window for Electric Potential, locate the Boundary Selection section.
3
From the Selection list, choose Negative.
4
Locate the Electric Potential section. In the V0 text field, type -Udc.
Electric Currents (ec)
1
In the Model Builder window, under Component 1 (comp1) click Electric Currents (ec).
2
In the Settings window for Electric Currents, click to expand the Dependent Variables section.
3
In the Electric potential text field, type V.
Now define the boundary conditions for the AC field.
Electric Potential 1
1
In the Physics toolbar, click  Boundaries and choose Electric Potential.
2
In the Settings window for Electric Potential, locate the Boundary Selection section.
3
From the Selection list, choose Positive.
4
Locate the Electric Potential section. In the V0 text field, type Vac.
Electric Potential 2
1
In the Physics toolbar, click  Boundaries and choose Electric Potential.
2
In the Settings window for Electric Potential, locate the Boundary Selection section.
3
From the Selection list, choose Negative.
4
Locate the Electric Potential section. In the V0 text field, type -Vac.
Specify the properties of the ions. The charge number remains at 1 and the ion mass is set by a parameter which was defined eariler.
Charged Particle Tracing (cpt)
Particle Properties 1
1
In the Model Builder window, under Component 1 (comp1)>Charged Particle Tracing (cpt) click Particle Properties 1.
2
In the Settings window for Particle Properties, locate the Charge Number section.
3
In the Z text field, type 1.
4
Locate the Particle Mass section. In the mp text field, type mi.
5
In the Model Builder window, click Charged Particle Tracing (cpt).
6
In the Settings window for Charged Particle Tracing, locate the Particle Release and Propagation section.
7
In the Maximum number of secondary particles text field, type 0.
The particles are released based on the mesh elements in the aperture. Furthermore, the particles are released at different phases of the first RF cycle.
Release 1
1
In the Physics toolbar, click  Domains and choose Release.
2
3
In the Settings window for Release, locate the Release Times section.
4
Click  Range.
5
In the Range dialog box, choose Number of values from the Entry method list.
6
In the Start text field, type 0.
7
In the Stop text field, type 1/4E6.
8
In the Number of values text field, type 11.
9
Click Replace.
There are two forces acting on the particles. One is due to the DC electric field and one is due to the AC electric field. To add these, simply add two Electric Force features. The Use piecewise polynomial recovery check box is selected so that the electric field is as accurate as possible.
Electric Force 1
1
In the Physics toolbar, click  Domains and choose Electric Force.
2
Click in the Graphics window and then press Ctrl+A to select both domains.
3
In the Settings window for Electric Force, locate the Electric Force section.
4
From the E list, choose Electric field (es/ccn1).
5
Locate the Advanced Settings section. Select the Use piecewise polynomial recovery on field check box.
For the AC force, the Multiply force by phase angle check box must be selected. This ensures that the magnitude of the electric field is multiplied by ejωt as the particles are traveling down the trap.
Electric Force 2
1
In the Physics toolbar, click  Domains and choose Electric Force.
2
Click in the Graphics window and then press Ctrl+A to select both domains.
3
In the Settings window for Electric Force, locate the Electric Force section.
4
From the E list, choose Electric field (ec/cucn1).
5
Locate the Advanced Settings section. From the Time dependence of field list, choose Time harmonic.
6
Select the Use piecewise polynomial recovery on field check box.
Mesh 1
1
In the Model Builder window, under Component 1 (comp1) click Mesh 1.
2
In the Settings window for Mesh, locate the Physics-Controlled Mesh section.
3
From the Element size list, choose Extra fine.
4
Click  Build All.
Now add the study to compute the fields and the particle trajectories. Solve the problem using two study steps. First, compute the AC and DC electric fields. Then, using the computed fields to define the electric force, solve for the particle trajectories. These steps are wrapped with a parametric sweep over the parameter q. The number of parameters in the sweep is increased between the limits of 0.6 and 0.8 since this is where the transmission probability will be highest.
Add Study
1
In the Home toolbar, click  Add Study to open the Add Study window.
2
Go to the Add Study window.
3
Find the Studies subsection. In the Select Study tree, select Empty Study.
4
Click Add Study in the window toolbar.
5
In the Home toolbar, click  Add Study to close the Add Study window.
Study 1
Parametric Sweep
1
In the Study toolbar, click  Parametric Sweep.
2
In the Settings window for Parametric Sweep, locate the Study Settings section.
3
4
Frequency Domain
1
In the Study toolbar, click  Study Steps and choose Frequency Domain>Frequency Domain.
2
In the Settings window for Frequency Domain, locate the Study Settings section.
3
In the Frequencies text field, type 4E6.
4
Locate the Physics and Variables Selection section. In the table, clear the Solve for check box for Charged Particle Tracing (cpt).
Time Dependent
1
In the Study toolbar, click  Study Steps and choose Time Dependent>Time Dependent.
2
In the Settings window for Time Dependent, locate the Study Settings section.
3
Click  Range.
4
In the Range dialog box, type 160/4e6 in the Stop text field.
5
In the Step text field, type 1/4e6.
6
Click Replace.
7
In the Settings window for Time Dependent, locate the Physics and Variables Selection section.
8
In the table, clear the Solve for check boxes for Electrostatics (es) and Electric Currents (ec).
9
Click to expand the Values of Dependent Variables section. Find the Values of variables not solved for subsection. From the Settings list, choose User controlled.
10
From the Method list, choose Solution.
11
From the Study list, choose Study 1, Frequency Domain.
12
In the Study toolbar, click  Compute.
Results
Three plots are created by default. The first two show the electric potential distributions for the AC and DC fields.
Particle Trajectories (cpt)
1
In the Model Builder window, under Results click Particle Trajectories (cpt).
2
In the Settings window for 2D Plot Group, locate the Data section.
3
From the Parameter value (q) list, choose 0.1.
4
In the Particle Trajectories (cpt) toolbar, click  Plot.
5
Click the  Zoom Extents button in the Graphics toolbar.
The particle positions at the final time are plotted for q = 0.1. To reproduce the remaining plots in Figure 4, select the values 0.6, 0.7, and 1.0 from the Parameter value (q) list, then click Plot.
Particle 1
In order to compute the transmission probability, it is necessary to add a second Particle dataset, and then add a Selection to it. The number of particles counted on this selection divided by the total number of particles is the transmission probability for the selection. This value is stored in a variable called alpha. The fraction of particles that do not strike the rods, 1-alpha, is the transmission probability for the QMF.
Particle 2
1
In the Model Builder window, expand the Results>Datasets node.
2
Right-click Results>Datasets>Particle 1 and choose Duplicate.
Selection
1
In the Results toolbar, click  Attributes and choose Selection.
2
In the Settings window for Selection, locate the Geometric Entity Selection section.
3
From the Geometric entity level list, choose Boundary.
4
From the Selection list, choose All boundaries.
5
Now plot the transmission probability of the QMF as a function of q.
Transmission Probability
1
In the Results toolbar, click  1D Plot Group.
2
In the Settings window for 1D Plot Group, type Transmission Probability in the Label text field.
3
Locate the Data section. From the Dataset list, choose Particle 2.
4
From the Time selection list, choose Last.
Global 1
1
Right-click Transmission Probability and choose Global.
2
In the Settings window for Global, locate the y-Axis Data section.
3
4
Locate the x-Axis Data section. From the Axis source data list, choose Outer solutions.
5
Click to expand the Legends section. Clear the Show legends check box.
6
In the Transmission Probability toolbar, click  Plot. Compare the resulting plot to Figure 5.