PDF

An Electrodynamic Levitation Device
Introduction
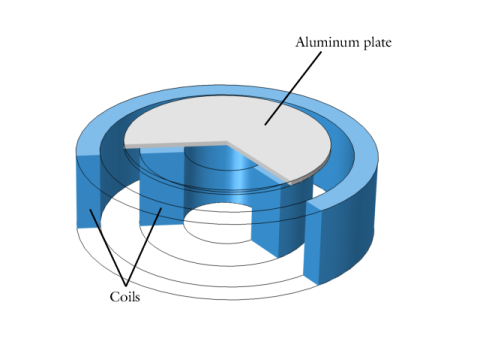
This verification application is based on the TEAM benchmark problem 28, “An Electrodynamic Levitation Device” (Ref. 1). The device consists of a circular aluminum plate placed above two cylindrical, concentric coils carrying sinusoidal currents in opposite directions. The time-varying magnetic field created by the coils induces eddy currents in the plate, which, in turn, give rise to a repulsive force sufficient to make the plate levitate at a certain height above the coil.
The application models the dynamics of the plate in the time domain, from when the coils are energized to the end of the transient after 1.7 s. The results, and, in particular, the position of the plate, are compared with the experimental data available from the TEAM problem specification.
Model Definition
Due to the rotational symmetry of the system, a two-dimensional axisymmetric geometry is used. The magnetic problem, including the eddy currents, is solved using the Magnetic Field interface, while the rigid body dynamic of the plate is solved as a system of ordinary differential equations (ODE) implemented using the Global ODEs and DAEs interface. Finally, the movement of the plate is modeled using the Moving Mesh interface.
The Magnetic Problem
The Magnetic Fields interface is used to compute the magnetic fields and eddy currents. The Coil feature with the Homogenized multi-turn model is used for the current carrying wire bundles. This feature applies a homogenized uniform current density in azimuthal direction.
The force acting on the plate is computed by using a Force Calculation feature, which integrates Maxwell’s stress tensor on the boundaries of the plate.
The Plate Dynamics
The plate moves as a rigid body subject to two forces: gravity and the electromagnetic force acting on the induced eddy currents. Due to symmetry, the plate only moves axially; the z-component of the plate displacement is governed by the ODE:
(1)
where Fem is the electromagnetic force, Fg is the gravity, and mp is the mass of the plate. This ODE is solved using a Global ODEs and DAEs interface. It is reformulated as a system of first-order ODEs, which usually benefit of improved performance and stability:
(2)
The Moving Mesh Interface
The Moving Mesh interface can be used in models where all or part of the geometry is moving with respect to the “laboratory” reference frame. In COMSOL Multiphysics, this reference frame is called the Spatial frame and its coordinates are, by default, lowercase letters (x, y, z or r, phi, z in axial symmetry). The frame at rest with the materials is called the Material frame and, by default, has uppercase coordinates (X, Y, Z or R, PHI, Z in axial symmetry).
The Moving Mesh interface deforms the mesh in the spatial frame as defined by the frame transformation:
(3)
The variables x, y, and z are the coordinates of a point of the mesh in the spatial frame. The functions f, g, and h are arbitrary, although they usually are functions of the coordinates of the point in the material frame (X, Y, Z).
The functions f, g, and h can be explicitly defined by the user by means of the Prescribed Deformation feature, or can be computed by the Moving Mesh interface starting from appropriate user-defined boundary conditions during the solution, if the Free Deformation feature is used. It is important to ensure that the functions are continuous everywhere and that they do not give rise to inverted mesh elements.
In this application, to improve the solution performance, the functions are explicitly given. In axisymmetry, the plate is represented as a rectangle touching the axis, surrounded by a void (air) region:
Figure 1: Axisymmetric representation of the system.
The in-plane coordinates in the axisymmetric geometry are rz (spatial frame) and RZ (material frame). The frame transformation functions used are:
(4)
where u is the instantaneous plate displacement, and h is chosen so that it varies continuously from zero at the exterior boundaries of the air region and to u in the plate. Due to the symmetry, h can be written as:
(5)
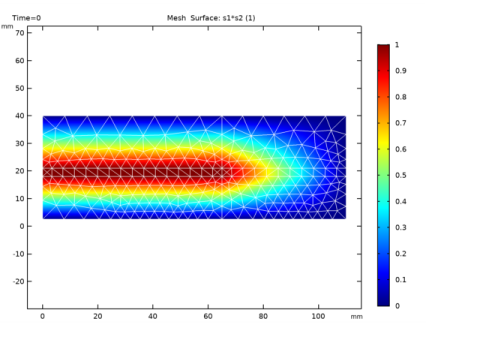
where s1 and s2 are maps (parameterization) of the geometry, defined using Variable features. The product s1s2 is plotted in Figure 2.
Figure 2: Parameterization of the deformed domain. The parameterization is used to rigidly move the plate and deform continuously the mesh in the surrounding air domain.
Solving in the Time Domain
The system evolves with two time scales: the AC feed has a frequency of 50 Hz, while the plate dynamic is in the order of the tenth of a second. The time steps specified in the Time Domain study step determine the stored time instants available for postprocessing. A smaller time step means that more time instants will be available for plotting, at the cost of increased memory usage.
The size of the specified time steps does not affect the solution, only the postprocessing: the solver automatically chooses an appropriate step size to resolve the fastest of the two time scale. The step size chosen in this application is small enough to resolve the plate dynamic, but not the AC frequency. To accurately postprocess the plate displacement, a Probe is used, that records the value of a specified variable at all the time steps taken by the solver.
Results and Discussion
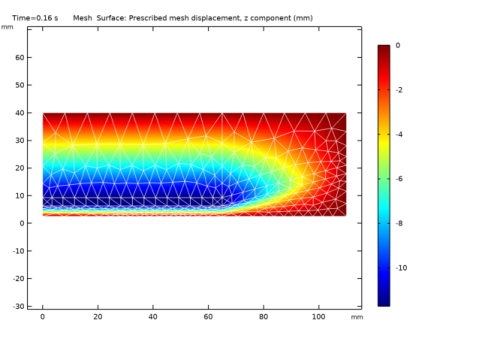
The application uses the Results While Solving functionality to visualize the deformation of the mesh during the solution process. Figure 3 shows the mesh and the deformation at t = 0.16 s, when the plate is at the lowest point of the first oscillation. The mesh is deformed according to the function defined in the Prescribed Deformation feature to accommodate the displacement of the plate.
Figure 3: Mesh plot (wireframe) and vertical deformation (color) at t = 0.16 s.
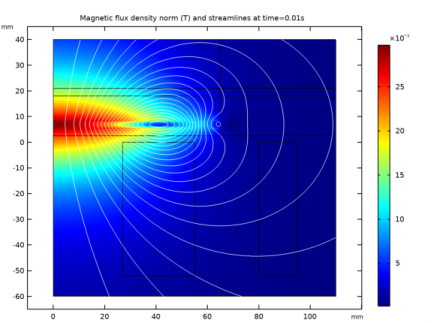
Figure 4 shows the magnetic flux density norm and force lines at t = 0.01 s.
Figure 4: Magnetic flux density norm and field lines at t = 0.01 s.
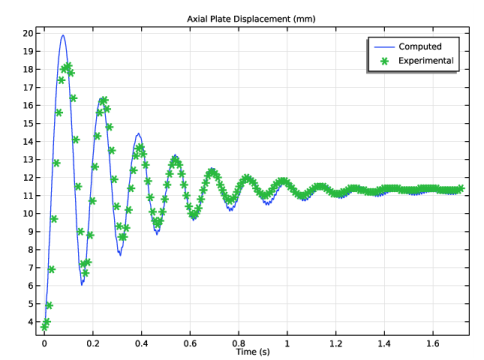
Figure 5 shows a comparison between the computed plate dynamic (the axial displacement) and the experimental data provided in Ref. 1. The dynamics is generally well-resolved, the discrepancy being accountable to the assumptions taken in modeling the coils as uniform bundles of wires with sharp rectangular cross sections, as detailed in the original reference.
Figure 5: Computed vertical plate displacement as a function of time (blue line), compared with experimental results (green markers).
Reference
1. http://www.compumag.org/jsite/team.html
Application Library path: ACDC_Module/Verification_Examples/electrodynamic_levitation_device
Modeling Instructions
From the File menu, choose New.
New
In the New window, click  Model Wizard.
Model Wizard
1
In the Model Wizard window, click  2D Axisymmetric.
2
In the Select Physics tree, select AC/DC>Electromagnetic Fields>Magnetic Fields (mf).
3
Click Add.
4
In the Select Physics tree, select Mathematics>ODE and DAE Interfaces>Global ODEs and DAEs (ge).
5
Click Add.
6
In the Select Physics tree, select Mathematics>Deformed Mesh>Moving Mesh (ale).
7
Click Add.
8
Click  Study.
9
In the Select Study tree, select General Studies>Time Dependent.
10
Global Definitions
Import the model parameters from a text file.
Parameters 1
1
In the Model Builder window, under Global Definitions click Parameters 1.
2
In the Settings window for Parameters, locate the Parameters section.
3
Click  Load from File.
4
Geometry 1
Create the 2D axisymmetric geometry.
1
In the Model Builder window, under Component 1 (comp1) click Geometry 1.
2
In the Settings window for Geometry, locate the Units section.
3
From the Length unit list, choose mm.
Coil 1
1
In the Geometry toolbar, click  Rectangle.
2
In the Settings window for Rectangle, type Coil 1 in the Label text field.
3
Locate the Size and Shape section. In the Width text field, type 28.
4
In the Height text field, type 52.
5
Locate the Position section. From the Base list, choose Center.
6
In the r text field, type 41.
7
In the z text field, type -26.
Coil 2
1
In the Geometry toolbar, click  Rectangle.
2
In the Settings window for Rectangle, type Coil 2 in the Label text field.
3
Locate the Size and Shape section. In the Width text field, type 15.
4
In the Height text field, type 52.
5
Locate the Position section. From the Base list, choose Center.
6
In the r text field, type 87.5.
7
In the z text field, type -26.
Add a layered rectangle for the plate and the air domains. The layered structure will make it easier to define the mesh deformation.
Rectangle 3 (r3)
1
In the Geometry toolbar, click  Rectangle.
2
In the Settings window for Rectangle, locate the Size and Shape section.
3
In the Width text field, type 120.
4
In the Height text field, type 50-2.5.
5
Locate the Position section. In the z text field, type 2.5.
6
Click to expand the Layers section. In the table, enter the following settings:
7
Click  Build Selected.
Rectangle 4 (r4)
1
In the Geometry toolbar, click  Rectangle.
2
In the Settings window for Rectangle, locate the Size and Shape section.
3
In the Width text field, type 120.
4
In the Height text field, type 50-2.5.
5
Locate the Position section. In the z text field, type 2.5.
6
Locate the Layers section. In the table, enter the following settings:
7
Clear the Layers on bottom check box.
8
Select the Layers to the left check box.
9
Click  Build Selected.
Rectangle 5 (r5)
1
In the Geometry toolbar, click  Rectangle.
2
In the Settings window for Rectangle, locate the Size and Shape section.
3
In the Width text field, type 120.
4
In the Height text field, type 72.5.
5
Locate the Position section. In the z text field, type -70.
6
Locate the Layers section. In the table, enter the following settings:
7
Select the Layers to the right check box.
8
Click  Build Selected.
9
Click the  Zoom Extents button in the Graphics toolbar.
The geometry is now complete.
Definitions
Create an explicit selection for the infinite element domain.
Infinite Element Domain
1
In the Definitions toolbar, click  Explicit.
2
In the Settings window for Explicit, type Infinite Element Domain in the Label text field.
3
Infinite Element Domain 1 (ie1)
1
In the Definitions toolbar, click  Infinite Element Domain.
2
In the Settings window for Infinite Element Domain, locate the Domain Selection section.
3
From the Selection list, choose Infinite Element Domain.
4
Locate the Geometry section. From the Type list, choose Cylindrical.
Materials
Define the materials to be used in the model.
Air
1
In the Model Builder window, under Component 1 (comp1) right-click Materials and choose Blank Material.
2
In the Settings window for Material, type Air in the Label text field.
3
Locate the Material Contents section. In the table, enter the following settings:
Aluminum
1
Right-click Materials and choose Blank Material.
2
In the Settings window for Material, type Aluminum in the Label text field.
3
4
Locate the Material Contents section. In the table, enter the following settings:
The plate is a solid conductor moving in the reference frames. To correctly take into account the effects of a conductor moving in a magnetic fields, explicitly set the material type to Solid.
Magnetic Fields (mf)
Ampère’s Law 2
1
In the Model Builder window, under Component 1 (comp1) right-click Magnetic Fields (mf) and choose Ampère’s Law.
2
3
In the Settings window for Ampère’s Law, locate the Material Type section.
4
From the Material type list, choose Solid.
Create the two Coil features.
Coil 1
1
In the Physics toolbar, click  Domains and choose Coil.
2
3
In the Settings window for Coil, locate the Material Type section.
4
From the Material type list, choose Solid.
5
Locate the Coil section. From the Conductor model list, choose Homogenized multiturn.
6
In the Icoil text field, type I0*sin(2*pi*f0*t).
7
Locate the Homogenized Multiturn Conductor section. In the N text field, type Ni.
8
From the Coil wire cross-section area list, choose From round wire diameter.
9
In the dcoil text field, type d_wire.
Coil 2
1
In the Physics toolbar, click  Domains and choose Coil.
2
3
In the Settings window for Coil, locate the Material Type section.
4
From the Material type list, choose Solid.
5
Locate the Coil section. From the Conductor model list, choose Homogenized multiturn.
6
In the Icoil text field, type -I0*sin(2*pi*f0*t).
7
Locate the Homogenized Multiturn Conductor section. In the N text field, type No.
8
From the Coil wire cross-section area list, choose From round wire diameter.
9
In the dcoil text field, type d_wire.
Force Calculation 1
1
In the Physics toolbar, click  Domains and choose Force Calculation.
2
Add variables to use in the definition of the plate dynamics.
Definitions
Variables 1
1
In the Model Builder window, under Component 1 (comp1) right-click Definitions and choose Variables.
2
In the Settings window for Variables, locate the Variables section.
3
Plate Dynamics
Specify the plate dynamics as a pair of ordinary differential equations. To obtain a better performance and stability during the solution process it is usually a good idea to specify first-order ODEs only. To do so, add an additional degree of freedom for the plate velocity.
1
In the Model Builder window, under Component 1 (comp1) click Global ODEs and DAEs (ge).
2
In the Settings window for Global ODEs and DAEs, type Plate Dynamics in the Label text field.
Global Equations 1
1
In the Model Builder window, under Component 1 (comp1)>Plate Dynamics (ge) click Global Equations 1.
2
In the Settings window for Global Equations, locate the Units section.
3
Click  Select Dependent Variable Quantity.
4
In the Physical Quantity dialog box, type velocity in the text field.
5
Click  Filter.
6
In the tree, select General>Velocity (m/s).
7
8
In the Settings window for Global Equations, locate the Units section.
9
Click  Select Source Term Quantity.
10
In the Physical Quantity dialog box, type acceleration in the text field.
11
Click  Filter.
12
In the tree, select General>Acceleration (m/s^2).
13
14
In the Settings window for Global Equations, locate the Global Equations section.
15
Global Equations 2
1
In the Global ODEs and DAEs toolbar, click  Global Equations.
2
In the Settings window for Global Equations, locate the Units section.
3
Click  Select Dependent Variable Quantity.
4
In the Physical Quantity dialog box, type displacement in the text field.
5
Click  Filter.
6
In the tree, select General>Displacement (m).
7
8
In the Settings window for Global Equations, locate the Units section.
9
Click  Select Source Term Quantity.
10
In the Physical Quantity dialog box, type velocity in the text field.
11
Click  Filter.
12
In the tree, select General>Velocity (m/s).
13
14
In the Settings window for Global Equations, locate the Global Equations section.
15
Definitions
Now define the mesh deformation consistently with the movement of the plate. Start by parameterizing the deformed regions with dedicated variables.
z-Parameterization, Top
1
In the Model Builder window, under Component 1 (comp1) right-click Definitions and choose Variables.
2
In the Settings window for Variables, locate the Geometric Entity Selection section.
3
From the Geometric entity level list, choose Domain.
4
In the Label text field, type z-Parameterization, Top.
5
6
Locate the Variables section. In the table, enter the following settings:
z-Parameterization, Center
1
In the Model Builder window, right-click Definitions and choose Variables.
2
In the Settings window for Variables, type z-Parameterization, Center in the Label text field.
3
Locate the Geometric Entity Selection section. From the Geometric entity level list, choose Domain.
4
5
Locate the Variables section. In the table, enter the following settings:
z-Parameterization, Bottom
1
Right-click Definitions and choose Variables.
2
In the Settings window for Variables, type z-Parameterization, Bottom in the Label text field.
3
Locate the Geometric Entity Selection section. From the Geometric entity level list, choose Domain.
4
5
Locate the Variables section. In the table, enter the following settings:
r-Parameterization, Left
1
Right-click Definitions and choose Variables.
2
In the Settings window for Variables, type r-Parameterization, Left in the Label text field.
3
Locate the Geometric Entity Selection section. From the Geometric entity level list, choose Domain.
4
5
Locate the Variables section. In the table, enter the following settings:
r-Parameterization, Right
1
Right-click Definitions and choose Variables.
2
In the Settings window for Variables, type r-Parameterization, Right in the Label text field.
3
Locate the Geometric Entity Selection section. From the Geometric entity level list, choose Domain.
4
5
Locate the Variables section. In the table, enter the following settings:
Moving Mesh (ale)
Now apply the Moving Mesh interface to the regions to be deformed only, and prescribe the deformation in terms of the defined variables.
1
In the Model Builder window, under Component 1 (comp1) click Moving Mesh (ale).
2
In the Settings window for Moving Mesh, locate the Domain Selection section.
3
Click  Clear Selection.
4
5
Locate the Frame Settings section. From the Geometry shape function list, choose 1.
Prescribed Deformation 1
1
In the Physics toolbar, click  Domains and choose Prescribed Deformation.
2
In the Settings window for Prescribed Deformation, locate the Domain Selection section.
3
From the Selection list, choose All domains.
4
Locate the Prescribed Mesh Displacement section. In the dz text-field array, type (u-18[mm])*s1*s2 on the second row.
5
Right-click Prescribed Deformation 1 and choose Build All.
Study 1
Step 1: Time Dependent
1
In the Model Builder window, expand the Component 1 (comp1)>Mesh 1 node, then click Study 1>Step 1: Time Dependent.
2
In the Settings window for Time Dependent, locate the Study Settings section.
3
In the Output times text field, type range(0,0.01,1.7).
4
From the Tolerance list, choose User controlled.
5
In the Relative tolerance text field, type 0.001.
Definitions
Finally, add probes for the plate displacement variable and the Lorentz force.
Global Variable Probe 1 (var1)
1
In the Definitions toolbar, click  Probes and choose Global Variable Probe.
2
In the Settings window for Global Variable Probe, click Replace Expression in the upper-right corner of the Expression section. From the menu, choose Component 1 (comp1)>Plate Dynamics>u - Plate position - m.
3
Locate the Expression section. Select the Description check box.
4
Global Variable Probe 2 (var2)
1
In the Definitions toolbar, click  Probes and choose Global Variable Probe.
2
In the Settings window for Global Variable Probe, locate the Expression section.
3
In the Expression text field, type mf.Forcez_0.
4
Select the Description check box.
5
In the associated text field, type Electromagnetic force, z-component.
6
Click to expand the Table and Window Settings section. From the Output table list, choose New table.
7
From the Plot window list, choose New window.
Study 1
Set up the Results While Solving functionality to follow the plate movement and the mesh deformation during the solution process.
Solution 1 (sol1)
In the Study toolbar, click  Show Default Solver.
Results
In the Model Builder window, expand the Results node.
Study 1/Solution 1 (sol1)
In the Model Builder window, expand the Results>Datasets node, then click Study 1/Solution 1 (sol1).
Selection
1
In the Results toolbar, click  Attributes and choose Selection.
2
In the Settings window for Selection, locate the Geometric Entity Selection section.
3
From the Geometric entity level list, choose Domain.
4
2D Plot Group 1
1
In the Results toolbar, click  2D Plot Group.
2
In the Settings window for 2D Plot Group, locate the Plot Settings section.
3
From the Frame list, choose Spatial  (r, phi, z).
Mesh 1
1
Right-click 2D Plot Group 1 and choose Mesh.
2
In the Settings window for Mesh, locate the Coloring and Style section.
3
From the Element color list, choose None.
4
From the Wireframe color list, choose White.
Surface 1
1
In the Model Builder window, right-click 2D Plot Group 1 and choose Surface.
2
In the Settings window for Surface, click Replace Expression in the upper-right corner of the Expression section. From the menu, choose Component 1 (comp1)>Moving Mesh>Prescribed mesh displacement (spatial frame) - m>ale.dxz - Prescribed mesh displacement, z component.
Study 1
Step 1: Time Dependent
1
In the Model Builder window, under Study 1 click Step 1: Time Dependent.
2
In the Settings window for Time Dependent, click to expand the Results While Solving section.
3
Select the Plot check box.
4
In the Home toolbar, click  Compute (Notice that the Graphics window and the Probe Plot windows show the development of the system as it is being computed).
Results
2D Plot Group 1
Electromagnetic Force, z-component
1
In the Model Builder window, under Results click Probe Plot Group 3.
2
In the Settings window for 1D Plot Group, type Electromagnetic Force, z-component in the Label text field.
3
Click to expand the Title section. From the Title type list, choose Manual.
4
In the Title text area, type Electromagnetic Force, z-component (N).
5
Locate the Plot Settings section. Select the y-axis label check box.
6
Clear the y-axis label text field.
7
In the Electromagnetic Force, z-component toolbar, click  Plot.
Create a new dataset and a 2D plot of the magnetic flux density.
Study 1/Solution 1 (3) (sol1)
In the Model Builder window, under Results>Datasets right-click Study 1/Solution 1 (sol1) and choose Duplicate.
Selection
1
In the Model Builder window, expand the Study 1/Solution 1 (3) (sol1) node, then click Selection.
2
2D Plot Group 4
1
In the Home toolbar, click  Add Plot Group and choose 2D Plot Group.
2
In the Settings window for 2D Plot Group, locate the Data section.
3
From the Dataset list, choose Study 1/Solution 1 (3) (sol1).
Surface 1
1
Right-click 2D Plot Group 4 and choose Surface.
Keep the default quantity to be plotted (the magnetic flux density norm).
Plot the lines of the magnetic flux density field. In 2D axisymmetry, these lines correspond to the isolines of the magnetic vector potential multiplied by the radius. Use a Contour plot to visualize this quantity, as it usually produces a more visually appealing plot.
Contour 1
1
In the Model Builder window, right-click 2D Plot Group 4 and choose Contour.
2
In the Settings window for Contour, click Replace Expression in the upper-right corner of the Expression section. From the menu, choose Component 1 (comp1)>Magnetic Fields>Magnetic>Magnetic vector potential (spatial frame) - Wb/m>mf.Aphi - Magnetic vector potential, phi component.
3
Modify the Expression to mf.Aphi*r
4
Locate the Expression section. In the Expression text field, type mf.Aphi*r.
5
Locate the Coloring and Style section. From the Coloring list, choose Uniform.
6
From the Color list, choose White.
7
Clear the Color legend check box.
Magnetic Flux Density
1
In the Model Builder window, under Results click 2D Plot Group 4.
2
In the Settings window for 2D Plot Group, type Magnetic Flux Density in the Label text field.
3
Locate the Data section. From the Time (s) list, choose 0.01.
4
Click to expand the Title section. From the Title type list, choose Manual.
5
In the Title text area, type Magnetic flux density norm (T) and streamlines at time=0.01s .
6
Clear the Parameter indicator text field.
7
In the Magnetic Flux Density toolbar, click  Plot.
Next, import the experimental data and compare with the computed solution.
Experimental Data
1
In the Results toolbar, click  Table.
2
In the Settings window for Table, type Experimental Data in the Label text field.
3
Locate the Data section. Click Import.
4
Plate Dynamics Comparison
1
In the Model Builder window, under Results click Probe Plot Group 2.
2
In the Settings window for 1D Plot Group, type Plate Dynamics Comparison in the Label text field.
3
Locate the Title section. From the Title type list, choose Manual.
4
In the Title text area, type Axial Plate Displacement (mm).
5
Locate the Plot Settings section. Select the x-axis label check box.
Probe Table Graph 1
1
In the Model Builder window, expand the Plate Dynamics Comparison node, then click Probe Table Graph 1.
2
In the Settings window for Table Graph, click to expand the Legends section.
3
From the Legends list, choose Manual.
4
Table Graph 2
1
In the Model Builder window, right-click Plate Dynamics Comparison and choose Table Graph.
2
In the Settings window for Table Graph, locate the Data section.
3
From the Table list, choose Experimental Data.
4
Locate the Coloring and Style section. Find the Line markers subsection. From the Marker list, choose Cycle.
5
From the Positioning list, choose In data points.
6
Find the Line style subsection. From the Line list, choose None.
7
Locate the Legends section. Select the Show legends check box.
8
From the Legends list, choose Manual.
9
10
In the Plate Dynamics Comparison toolbar, click  Plot.
Study 1/Solution 1 (3) (sol1)
Visualize the complete 3D geometry with a revolution dataset.
Study 1/Solution 1 (4) (sol1)
In the Model Builder window, under Results>Datasets right-click Study 1/Solution 1 (3) (sol1) and choose Duplicate.
Selection
1
In the Model Builder window, expand the Study 1/Solution 1 (4) (sol1) node, then click Selection.
2
Revolution 2D 1
1
In the Results toolbar, click  More Datasets and choose Revolution 2D.
2
In the Settings window for Revolution 2D, locate the Data section.
3
From the Dataset list, choose Study 1/Solution 1 (4) (sol1).
4
Click to expand the Revolution Layers section. In the Start angle text field, type -90.
5
In the Revolution angle text field, type 240.
6
In the Start angle text field, type 0.
7
In the Revolution angle text field, type 360.
3D Plot Group 5
In the Results toolbar, click  3D Plot Group.
Volume 1
1
Right-click 3D Plot Group 5 and choose Volume.
2
In the Settings window for Volume, click Replace Expression in the upper-right corner of the Expression section. From the menu, choose Component 1 (comp1)>Magnetic Fields>Currents and charge>Current density (spatial frame) - A/m²>mf.Jphi - Current density, phi component.
Current Density
1
In the Model Builder window, under Results click 3D Plot Group 5.
2
In the Settings window for 3D Plot Group, type Current Density in the Label text field.
3
Locate the Plot Settings section. From the Frame list, choose Spatial  (r, phi, z).
4
In the Current Density toolbar, click  Plot.
Animation 1
Finally, create an animation of the moving plate.
1
In the Results toolbar, click  Animation and choose Player.
2
In the Settings window for Animation, locate the Scene section.
3
From the Subject list, choose Current Density.
4
Locate the Animation Editing section. From the Time selection list, choose From list.
5
From the Times (s) list, choose all the time steps up to 1.2.
6
Locate the Frames section. In the Number of frames text field, type 50.
7
In the Graphics toolbar, click Play.