You are viewing the documentation for an older COMSOL version. The latest version is available here.
Measuring Mesh Quality
Use the stat method on the meshing sequence to get information on the mesh quality. The quality measure is a scalar quantity, defined for each mesh element, where 0 represents the lowest quality and 1 represents the highest quality.
The following commands show how to visualize the mesh quality for a mesh on the unit circle:
model = ModelUtil.create('Model');
comp1 = model.component.create('comp1', true);
geom1 = comp1.geom.create('geom1', 2);
geom1.feature.create('c1', 'Circle');
geom1.runAll;
 
mesh1 = comp1.mesh.create('mesh1');
mesh1.feature.create('ftri1', 'FreeTri');
mesh1.run;
 
meshdset1 = model.result.dataset.create('mesh1', 'Mesh');
meshdset1.set('mesh', 'mesh1');
 
pg1 = model.result.create('pg1', 2);
 
meshplot1 = pg1.feature.create('mesh1', 'Mesh');
meshplot1.set('data', 'mesh1');
meshplot1.set('filteractive', 'on');
meshplot1.set('elemfilter', 'quality');
meshplot1.set('tetkeep', 0.25);
mphplot(model,'pg1','rangenum',1);
meshplot1.set('elemfilter','qualityrev');
mphplot(model,'pg1','rangenum',1);
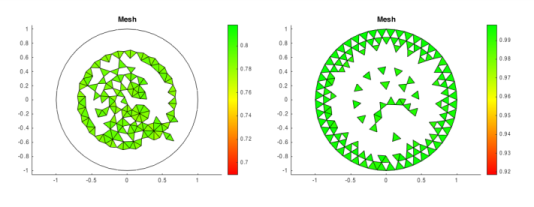
These commands display the worst 25% and the best 25% elements in terms of mesh element quality. In Figure 3-17, the triangular mesh elements in the right-hand side plot are more regular than those in the left-hand side plot; this reflects the fact that a quality measure of 1 corresponds to a uniform triangle, while 0 means that the triangle has degenerated into a line.
Figure 3-17: Visualizations of the mesh quality: worst 25% (left) and best 25% (right).
Code for use with MATLAB®
model = ModelUtil.create('Model');
comp1 = model.component.create('comp1', true);
geom1 = comp1.geom.create('geom1', 2);
geom1.feature.create('c1', 'Circle');
geom1.runAll;
mesh1 = comp1.mesh.create('mesh1', 'geom1');
mesh1.feature.create('ftri1', 'FreeTri');
mesh1.run;
meshdset1 = model.result.dataset.create('mesh1', 'Mesh');
meshdset1.set('mesh', 'mesh1');
pg1 = model.result.create('pg1', 2);
meshplot1 = pg1.feature.create('mesh1', 'Mesh');
meshplot1.set('data', 'mesh1');
meshplot1.set('filteractive', 'on');
meshplot1.set('elemfilter', 'quality');
meshplot1.set('tetkeep', 0.25);
mphplot(model,'pg1','rangenum',1);
meshplot1.set('elemfilter','qualityrev');
mphplot(model,'pg1','rangenum',1);