You are viewing the documentation for an older COMSOL version. The latest version is
available here
.
Phenomenology and Testing
The underlying reason for fatigue must be investigated on the micromechanical scale where materials are not homogeneous. In an alloy there are grains and the grain boundaries cause stress concentrations. In a casting there might even be pores that are formed during the solidification. Therefore, on a local scale, the strains might be much larger than the macroscopic average values and dislocations within the crystals are activated.
Statistical Effects
Because the locations of these micromechanical irregularities are more or less randomly distributed, there is a large scatter in the number of load cycles that a certain type of component can be subjected to, even if the external load is well-defined. This scatter makes it necessary to test many specimens when collecting fatigue data. Two examples of these statistical effects are:
•
If two sets of bars with different diameters are tested in tension with the same nominal stress, the larger one appears to have a shorter lifetime. The reason is that, within a larger volume of material, the risk of finding a microscopic defect of a certain size is larger.
•
If the same type of bar is tested in both tension and bending giving the same peak stress, the one tested in bending appears to have a longer lifetime. During bending, only a small volume of the material is subjected to the highest stress.
These types of effects are not included in the Fatigue Module, so you should choose your material data with this in mind.
Fatigue Testing
A pioneer in the field of fatigue was the German engineer August Wöhler who presented a classical work in 1870. His name is used in diagrams showing
stress amplitude
versus number of cycles to fatigue. These are called
Wöhler curves
or
S-N curves
(
Figure 3-2
).
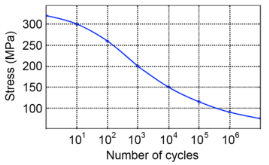
Figure 3-2:
Example of an S-N curve showing the material data for brittle aluminum with ultimate tensile strength of 320 MPa.
An S-N curve is usually obtained by testing different stress levels and recording the number of cycles to failure,
N
. Several specimens are tested at each level so that average and scatter can be computed, giving one point on the curve.
Because the S-N curve gives the level at which a certain percentage (often 50%) of a population can be expected to fail, that value cannot always be directly used for design.
Knowledge of the scatter in terms of the standard deviation is necessary to transform the given data to another, acceptable, level. For a certain number of cycles, a certain stress level is then connected to a probability of failure. The acceptable probability (and thus stress level) in a design can differ between, for example, a passenger aircraft and a lawn mower.
There are also different factors that can affect the S-N curves:
Environmental effects:
A corrosive environment is negative for the fatigue life. A material usually having a fatigue limit might not have one in a corrosive environment.
Surface finish:
Most data are obtained from polished specimens. Because microscopic irregularities are involved in the formation of fatigue cracks, a rough surface decreases fatigue life.
Statistical size effects:
As described in
Statistical Effects
.
Residual stresses from manufacturing:
This is sometimes used intentionally, for example by shot peening, which results in beneficial compressive stresses in the surface of the component.
Low-Cycle and High-Cycle Fatigue
There are two different regimes of the fatigue phenomena: low-cycle fatigue (LCF) and high-cycle fatigue (HCF). The border between the two is not exact, but usually a cycle count to fatigue larger than 10
4
is considered a “high cycle”. A characteristic of LCF is that significant plastic strains occur on the macroscopic scale during each load cycle.
For some materials (for example, many steel and titanium alloys), a lowest stress level exists, below which fatigue does not occur irrespective of the number of load cycles. This level is called the
fatigue limit
or
endurance limit
. Those limits are often of the order of half the ultimate tensile strength. Many materials such as aluminum and copper do not appear to have a fatigue limit.
Even for a material without a fatigue limit, such values are sometimes given. These actually represent the value of the S-N curve at a certain large number of cycles, for example, 10
8
.
Low-cycle fatigue is sometimes referred to as “strain-based” because the relevant parameter for describing LCF is strain rather than stress.
Physically it is the strain that does the damage in HCF as well. Because HCF occurs in the elastic regime, it is possible to use either stress or strain as the parameter. The use of stress has historical and practical reasons and therefore high-cycle fatigue is often referred to as “stress-based.”