where ρ is the density,
c is the speed of sound, and
ω gives the angular frequency. The subscript
c refers to that these can be complex valued.
In the absorbing glass wool, modeled as a Poroacoustics domain, the damping enters the equation as a complex speed of sound, cc = ω/
kc, and a complex density,
ρc = kc Zc/
ω, where
kc is the complex wave number and
Zc equals the complex impedance. This is a so-called equivalent fluid model for the porous domain where the losses are modeled in a homogenized way.
where Rf is the flow resistivity, and where
ka = ω/
ca and
Za = ρa ca are the free-space wave number and impedance of air, respectively. This model is the default selected for the Delany-Bazley-Miki model in the Poroacoustics domain feature. You can find flow resistivities in tables, see for example
Ref. 3 or by measuring it. For glass-wool-like materials, Bies and Hansen (
Ref. 2) give an empirical correlation
where ρap is the material’s apparent density and
dav is the mean fiber diameter. This model uses a lightweight glass wool with
ρap = 12 kg/m
3 and
dav = 10 μm.
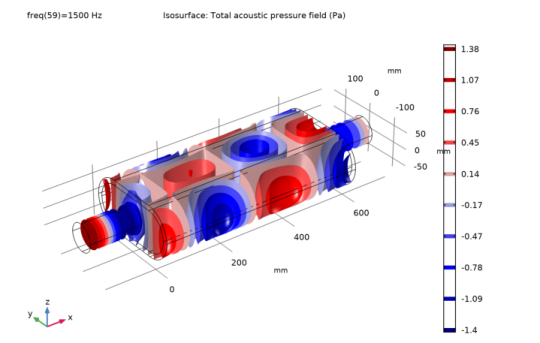
The pressure distribution in the absorptive muffler without the lining material is shown in Figure 9 for the frequency f = 1500 Hz. From the figure, it is seen that at this frequency not only longitudinal standing waves exist but also transverse modes are present.

Here Pin and
Pout denote the incoming power at the inlet and the outgoing power at the outlet, respectively. These values are readily defined by the port boundary conditions as
acpr.port1.P_in and
acpr.port2.P_out and can be directly used in postprocessing.

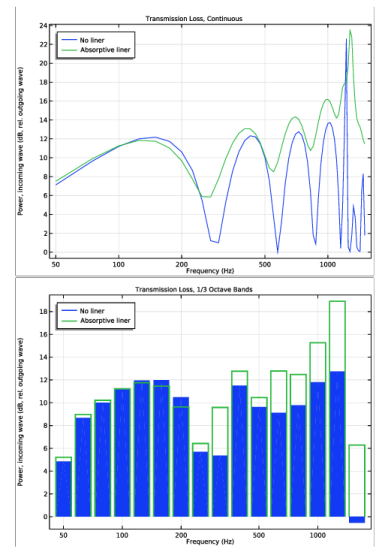
Figure 10 (top and bottom) shows the result of a parametric frequency study. The two graphs represent the case of an empty muffler without any absorbing lining material (blue lines) and the case with a layer of glass wool lining on the chamber’s walls (green lines). The first four dips are due to longitudinal resonances. In the muffler with absorbing lining, the dips are still present, but the general trend is that the higher the frequency, the better the damping. In the top figure, the transmission loss is depicted as a continuous curve (pure tone sweep) while it is depicted in 1/3 octave bands in the bottom figure. Both graphs are created using the Octave Band Plot of the Acoustics Module.
The flow of energy in the muffler without the liner is shown in Figure 11 at 1500 Hz. The plot represents the intensity field depicted as streamlines. The intensity field is per definition the time average of the energy flux (instantaneous intensity) and thus represents the average energy flow in the system: here from the inlet to the outlet. Change between solutions and frequencies to study and visualize the sound-absorbing properties of the muffler.


