A Poincaré Map can be used to plot the intersection points of rays with a plane. To use the Poincaré Map, a
Cut Plane data set must first be defined.
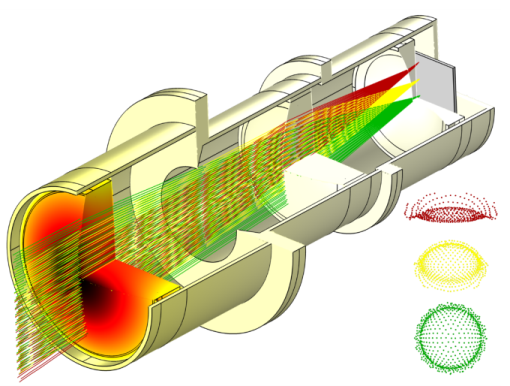
By placing the Cut Plane data set at the image plane of an optical system, it is possible to use the
Poincaré Map to create spot diagrams in order to evaluate the performance of the optical system.
A Phase Portrait can be used to plot the positions of rays in an arbitrarily defined phase space. For example, it is possible to plot rays in a 2D space in which one coordinate represents the optical path length and the other coordinate represents intensity. Like the
Poincaré Map, the
Phase Portrait can also be used to create spot diagrams.