You are viewing the documentation for an older COMSOL version. The latest version is available here.
PDF

Shell Conduction
Introduction
The following example illustrates how to build and solve a model using the Heat Transfer in Thin Shells interface. This example is a 2D NAFEMS benchmark (Ref. 1), which was transformed to 3D.
Model Definition
Figure 1 describes the 2D benchmark example.
Figure 1: A 2D benchmark example for a thin conductive shell.
The 3D model bends this plate so that it becomes a quarter of a cylinder (Figure 2).
Figure 2: The 3D geometry based on the 2D model.
Results
The temperature at point A in Figure 2 (291.40 K) is in agreement with that from the NAFEMS benchmark (Ref. 1). Figure 3 shows the temperature distribution.
Figure 3: The resulting temperature field of the 3D model.
Reference
1. J.A. Casey and G.B Simpson, “Two-dimensional Steady State,” Benchmark Tests for Thermal Analysis, NAFEMS, Test 10, p. 2.9, 1986.
Application Library path: Heat_Transfer_Module/Tutorials,_Thin_Structure/shell_conduction
Modeling Instructions
From the File menu, choose New.
New
In the New window, click Model Wizard.
Model Wizard
1
In the Model Wizard window, click 3D.
2
In the Select Physics tree, select Heat Transfer>Thin Structures>Heat Transfer in Shells (htlsh).
3
Click Add.
4
Click Study.
5
In the Select Study tree, select General Studies>Stationary.
6
Click Done.
Global Definitions
1
In the Model Builder window, under Global Definitions click Parameters 1.
2
In the Settings window for Parameters, locate the Parameters section.
3
Geometry 1
Cylinder 1 (cyl1)
1
In the Geometry toolbar, click Cylinder.
2
In the Settings window for Cylinder, locate the Object Type section.
3
From the Type list, choose Surface.
4
Locate the Size and Shape section. In the Radius text field, type 2/pi.
5
In the Height text field, type 0.6.
6
Click Build Selected.
Delete Entities 1 (del1)
1
In the Model Builder window, right-click Geometry 1 and choose Delete Entities.
2
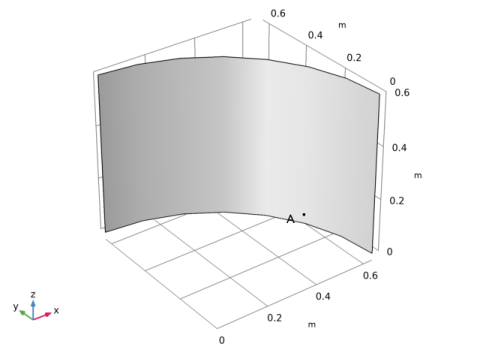
On the object cyl1, select Boundaries 1–3 only.
3
In the Settings window for Delete Entities, click Build Selected.
4
Click the Zoom Extents button in the Graphics toolbar.
Point 1 (pt1)
1
In the Geometry toolbar, click More Primitives and choose Point.
2
In the Settings window for Point, locate the Point section.
3
In the x text field, type (2/pi)*cos(pi*18/180).
4
In the y text field, type (2/pi)*sin(pi*18/180).
This step embeds the point where you compare the calculated solution with the benchmark.
5
Click Build Selected.
Materials
Single Layer Material 1 (slmat1)
1
In the Materials toolbar, click Blank Material.
2
In the Model Builder window, under Component 1 (comp1) right-click Materials and choose Layers>Single Layer Material.
3
In the Settings window for Single Layer Material, locate the Layer Definition section.
4
From the Material list, choose Material 1 (mat1).
5
Locate the Boundary Selection section. From the Selection list, choose All boundaries.
Material 1 (mat1)
1
In the Model Builder window, under Component 1 (comp1)>Materials click Material 1 (mat1).
2
In the Settings window for Material, locate the Material Contents section.
3
Heat Transfer in Shells (htlsh)
Temperature 1
1
In the Physics toolbar, click Edges and choose Temperature.
2
3
In the Settings window for Temperature, locate the Temperature section.
4
In the T0 text field, type T_edge.
Heat Flux 1
1
In the Physics toolbar, click Edges and choose Heat Flux.
2
3
In the Settings window for Heat Flux, locate the Heat Flux section.
4
Click the Convective heat flux button.
5
In the h text field, type ht.
6
In the Text text field, type T_ext.
Mesh 1
Mapped 1
1
In the Mesh toolbar, click Boundary and choose Mapped.
2
3
In the Settings window for Mapped, click Build All.
Study 1
In the Home toolbar, click Compute.
Results
Temperature (htlsh)
The default plot is the surface plot of the temperature and the arrow plot of the conductive heat flux; compare with Figure 3.
Derived Values
Follow the steps below to obtain the temperature at the benchmark verification point.
Point Evaluation 1
1
In the Results toolbar, click Point Evaluation.
2
3
In the Settings window for Point Evaluation, click Evaluate.
The result shown in the Table window below the Graphics window should be approximately 290.4 K.