|
|
Go to Common Results Node Settings for links to information about these sections: Data, Title, Levels, Range, Inherit Style, and Coloring and Style. See below for some specific settings in the Coloring and Style section.
|
|
|
|
•
|
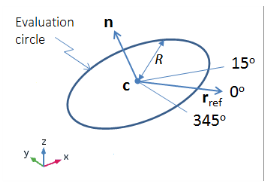
Choose With respect to angle (the default) to compute an expression with the level normalized with respect to the value at a specific angle. You specify the angle (in degrees) in the Angle field (unit: deg).
|
|
•
|
Choose With respect to maximum to compute the expression normalized with respect to its maximum level value for each frequency.
|
|
•
|
Choose None to not use any normalization.
|
|
•
|
|
|
•
|
|
|
•
|
Frequency on x-axis to plot with the frequency on the x-axis.
|
|
•
|
Frequency on y-axis to plot with the frequency on the y-axis.
|
|
•
|
Logarithmic (the default) to plot the frequency using a logarithmic scale.
|
|
•
|
Linear to plot the frequency using a linear scale.
|